Naive Bayes (HD)

The Naive Bayes operator calculates the probability of a particular event occurring. It can be used to predict the probability of a certain data point being in a particular classification.

Naive Bayes

Information at a Glance

Category Model
Data source type HD
Sends output to other operators Yes
Data processing tool Spark
Note: The Naive Bayes (Hadoop) operator is for Hadoop data only. For database data, use the Naive Bayes (Database) operator.

Algorithm

The Naive Bayes classifier calculates the probability of an event occurring. it combines Bayes' theorem with an assumption of strong independence among the predictors. Bayes' theorem calculates the probability of occurrence given a prior event has occurred. Regardless of actuality, a Naive Bayes classifier considers the influence of predictors on the outcome independently.

  • The Team Studio Naive Bayes Operator computes the dependent variable's class priors and each of the independent variables' probability distributions using the Naive Bayes' conditional probability theorem, with the independence assumption.
  • As an overview, the Naive Bayes conditional probability theorem says that, given a data set, X, and an outcome Hypothesis, H, the posterior probability that the Hypothesis is true is proportional to the product of the likelihood multiplied by the prior probability.
  • Depending on the precise nature of the probability model, Naive Bayes classifiers can be trained very efficiently in a supervised learning setting.
  • Given some data and some hypothesis, the posterior probability that the hypothesis is true is proportional to the product of the likelihood multiplied by the prior probability.
  • For simplicity, the "prior probability" is often abbreviated as the "prior" and the "posterior probability" as the "posterior".
  • The likelihood brings in the effect of the data, while the prior specifies the belief in the hypothesis before the data was observed.

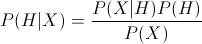
More formally, the Bayes' formula for conditional probability is represented as

conditional probability formula, where

  • P(H|X) is the conditional probability of outcome H happening given condition X
  • P(X|H) is the conditional probability of the outcome X happening given condition H
  • P(H) is the prior observed probability of the outcome H happening
  • P(X) is the prior observed probability of the outcome X happening.

This Bayes formula is helpful because it provides a way to calculate the Posterior Probability, P(H|X), from P(H), P(X|H), and P(X), which can be calculated from historic data.

posterior probability
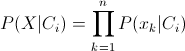
This is the Naive Bayes conditional independence assumption formula.

If the feature is a continuous value, the conditional distribution over the class variable C is expressed as follows:


conditional distribution over the class variable C

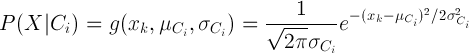
  • This formula describes the ideal normal distribution curve for each independent variable's value. Note: This is a simplification assumption since most of the independent variables are likely to have exactly normal distributions.
  • However, the Naive Bayes model predictions are still quite accurate with an acceptable level of confidence.
  • The Naive Bayes Operator can accept a dependent column that has two or more discrete categories. Note: if the dependent variable is a numeric integer, each integer is treated as a separate category.
  • The independence assumption treats all the predictors or variables as independently related to the outcome.
  • The Naive Bayes theorem results give the normal probability curve of each possible categorical value occurring for that variable.

Input

A data set that contains the dependent and independent variables for modeling.

Configuration

In Naive Bayes configuration, Dependent Column is the value in the data set that is the predicted dependent variable, or "class" variable. Column(s) are the expected independent variable data columns, or parameters, to use for model training.

The Dependent Column must be a categorical (non-numeric) variable. Naive Bayes analysis predicts the odds of an outcome of a categorical variable based on one or more predictor variables. A categorical variable is one that can take on a limited number of values, levels, or categories, such as valid or invalid.

Unlike Logistic Regression and Decision Tree classifiers, Naive Bayes does not require a Value To Predict specification, because the output for the Naive Bayes operator provides the probability of the event for each observed classification value.

Parameter Description
Notes Any notes or helpful information about this operator's parameter settings. When you enter content in the Notes field, a yellow asterisk is displayed on the operator.
Dependent Column A Dependent Column must be specified for the Naive Bayes classifier. Select the data column to consider the dependent variable or class to predict. The Dependent Column must be a categorical (non-numeric) type, such as eye color = blue, green or brown.

Integers are accepted, with each integer being treated as a category.

Columns Select the independent variable data columns to include for the regression analysis or model training.

At least one column or one interaction variable must be specified.

  • Either sparse columns (output from the Collapse operator) or non-sparse columns are supported, but not a mix of the two.
  • The limitations on the data dimensionality are 10 million values for a column of datatype = sparse and a total 4000 independent data columns.
Use Spark If Yes (the default), uses Spark to optimize calculation time.

Output

Visual Output
Summary Results
The 
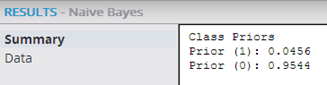
Summary results display the class priors, as follows.


Class Priors - The priors define the observed historical probability of the various possible classification outcome events for the dependent variable based on the training data for the model. This is helpful information because it shows an overall trend of the data for each possible outcome and allows a quick, intuitive check of the source data.

The modeler can see which of the possible dependent variable values occurred the most and least frequently in the training data.

In the example above, the training data showed a prior 4.56% occurrence of the Dependent Variable Class value being 1, and a 95.44% occurrence of the value being 0.
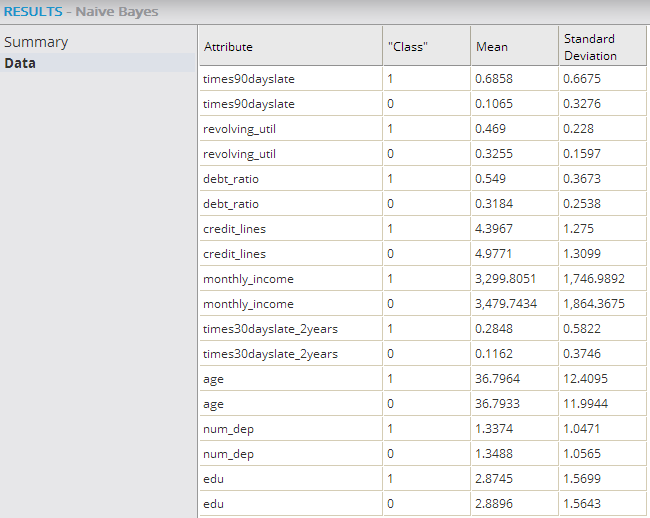
Data Results
The Data results display calculated standard deviation curve fit numbers (Means and Standard Deviations) for each independent variable (per dependent variable outcome) in the model.


Column Description
Attribute The name of the independent variable whose normal distribution curve is being described. When assessing Naive Bayes modeling results, each row in the Data table describes the normal distribution curve for each independent variable, given the specified class value specified for the dependent variable.

It provides the Class value for the observed curve and the associated Mean and Standard Deviation values of the curve.

Class Represents each possible value for the dependent variable being predicted.

For every possible dependent variable outcome value, the independent variable's normal distribution curve, as defined by its Mean and Standard Deviation values, is presented.

For example, for the independent variable that represents times90dayslate, when the dependent variable that represents credit delinquency (srsdlnqncy) is 1 (for true), the times90dayslate has a Mean value of .6785 times 90 days late, but when delinquency is false, it only has a Mean value of .1077 times 90 days late.

This makes sense in that the more times a person is 90 days late in paying their credit card bill, there is a better chance they will have serious credit card delinquency.

Mean Represents the average value of the independent variable given the specified Dependent Value class outcome.

The modeler should compare the Means of an independent variable across the different Class values. If there is a big difference in the Means (with respect to the Standard Deviation value), that particular variable is a stronger predictor of the dependent variable.

Note: If the Standard Deviation exceeds the Mean, then the Mean value, although the best possible, is not significant. However, as a rule of thumb, if the Standard Deviation is less than the square root of the Mean, the Mean is a useful measure of a variable's significance.
Note: If there is little or no difference in Means across Class values (that is, full overlap of the normal distribution curves), assuming small standard deviations, then that associated independent variable is likely not significant in the model.

If, for example, an age variable in the credit delinquency model above were to have the same Mean value whether the person is delinquent or not delinquent (with only a slight difference in the standard deviation of the curves), it would seem that a person's age was not a strong predictor of whether that person will be delinquent on their credit card payment.

Standard Deviation Represents the standard deviation of the independent variable value from the Mean given the Dependent Value class outcome specified. It tells how spread out the normal distribution curve is for that particular variable and a given class outcome.

Smaller Standard Deviations indicate a smaller range of independent variable values for a given Class value.

For each variable, the modeler should understand how the Standard Deviation values compare to the Mean values. A variable's Means might be different for different Class outcomes, but if the Standard Deviation is large, the normal distribution curves significantly overlap for any Class outcome, and therefore the variable is not really a good predictor in the Naive Bayes model.

Therefore, smaller Standard Deviations make the Means value a stronger indicator of whether a variable is relevant to the model. Additionally, the larger the Standard Deviation is in comparison to the Mean, the less confidence there is in the Mean.

For example, for the monthly_income variable, the Standard Deviation is over half the value of the Mean income, which seems to indicate that there is a large fluctuation in a person's monthly income when the person is both delinquent and not delinquent. The conclusion might be that monthly_income is a weak predictor of credit delinquency.

Large standard deviations could also be caused by random error (that is, natural noise) or systematic error (that is, poor data quality).

In summary, the more overlap between a given variable's normal distribution curves for all the different possible Class outcomes, the less predictive the variable is in a Naive Bayes model.

Data Output
Naive Bayes model. When creating a Naive Bayes model, the modeler should add Model Validation Operators1 to get further Naive Bayes model accuracy statistics (from the Goodness of Fit Operator) and/or visual outputs (from the ROC and Lift Operators). The ROC Curve in particular is a useful visual tool for comparing classification models.
1 See the Model Validation Operators section for more details.