PCA (HD)
Uses an orthogonal transformation to convert a set of observations of possibly correlated variables into a set of values of uncorrelated variables (principal components).

Algorithm
PCA (Principal Component Analysis) is an orthogonal linear transformation that transforms data into a new coordinate system such that the greatest variance by any projection of the data comes to lie on the first coordinate (called the first principal component), the second greatest variance on the second coordinate, the third on the third coordinate, continuing until the number of rows has been reached or a preset maximum principal component threshold has been reached.
The Alpine PCA operator implements an eigenvalue decomposition of a data covariance matrix Σ (or, correlation matrix R).
- Each principal component is a linear combination of the original variables.
- The coefficients (loadings) are the eigenvectors (v1, v2,...vp) of covariance matrix Σ (or, correlation matrix R) with unit length.
- The eigenvalues (λ1, λ2,...λp) denote the contribution of the principal component associated with it.
- The principal components are sorted by descending order according to their variance contribution.
- The user can choose the number of principal components according to the accumulation contribution (∑ij=1λj/∑pK=1λK).
More details are available in Principal Component Analysis, (1986), Joliffe, I.T.
Additional references:
- Jerome Friedman, Trevor Hastie, Robert Tibshirani (2008), The Elements of Statistical Learning Data Mining, Inference and Prediction Chapter 3: "Linear Methods for Regression"
- Joliffe, I.T. (1986), Principal Component Analysis, New York, Springer
- Wu, W., Massart, D.L., and de Jong, S. (1997), "The Kernel PCA Algorithms for Wide Data. Part I: Theory and Algorithms" Chemometrics and Intelligent Laboratory Systems, 36, 165-172.
Output
- Visual Output
- The visual output for Hadoop provides visualizations of the principal components and their contribution weightings, scaling, centering, variance, and cumulative variance.
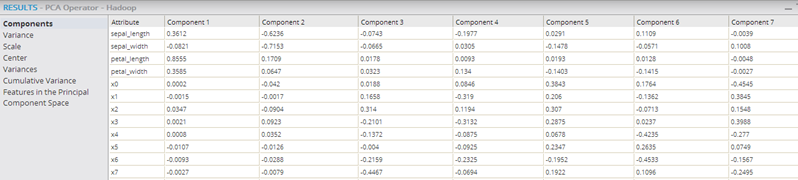
- Components
- Shows the new principal components as the columns and each row provides the source data variable's contribution to the derived component value.
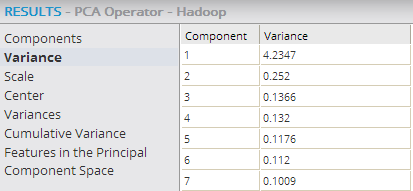
- Variance
- Shows each principal component's contribution to the overall data variance. Variance provides a measure of how much of all the variance in the original data set is captured by a given component.
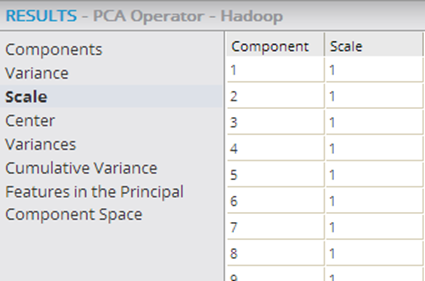
- Scale
- Shows the relative size of the source data set's columns relative to their original values passed in. Note: if the value is not "1" (meaning 100% of its original value), no scaling was done prior to running the PCA algorithm.
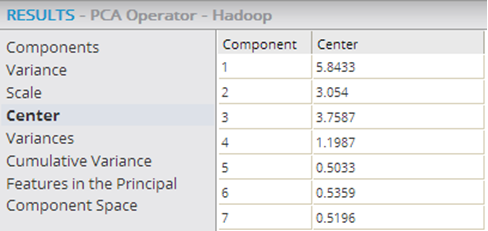
- Center
- Shows if any centering was done to the original data set column to clean up the data before computing the principal components. The data displayed shows the center value of the original data set's columns that were used in the PCA algorithm. Note: If the values are not 0, the data was not centered prior to running the algorithm. It is best to normalize the source data and center it around 0 before running the PCA algorithm.
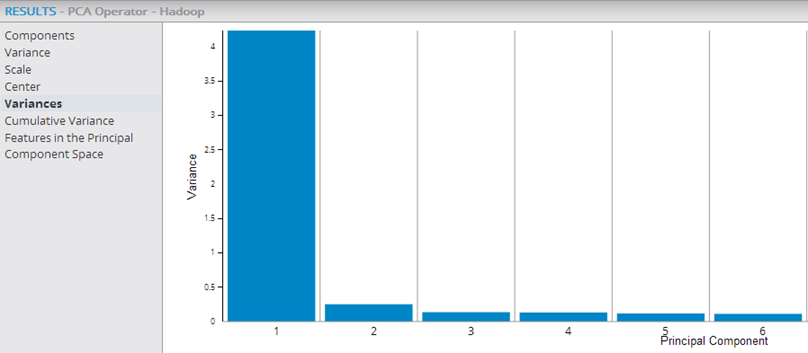
- Variances
- Shows each principal component's contribution to the overall data variance (for the Variance data provided above). Variance provides a measure of how much of all the variance in the original data set is captured by a given component. The visualization output is helpful to quickly see how many of the principal components explain most of the data set's variance. If the first few principal components have higher Variance values and then the values drop off, those are the components that should be used as the reduced dimension data set.
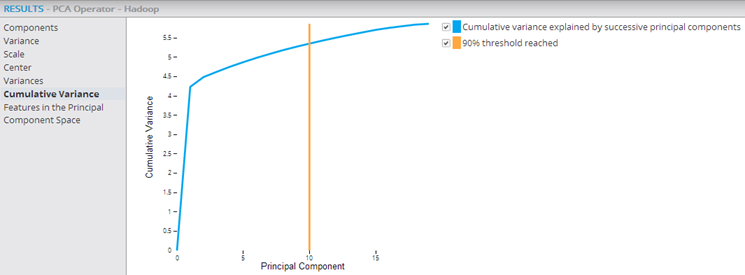
- Cumulative Variance
- This graph provides a visualization of the cumulative importance of each principal component (starting with the most significant principal component) and of how effectively the components explain the data set. The 90% Threshold Reached line shows the cumulative principal component point at which 90% of the data variance is explained. This helps know how many of the principal components explain the bulk of the data variance. In the example below, it is the first 10 principal components that explain 90% of the data variance.
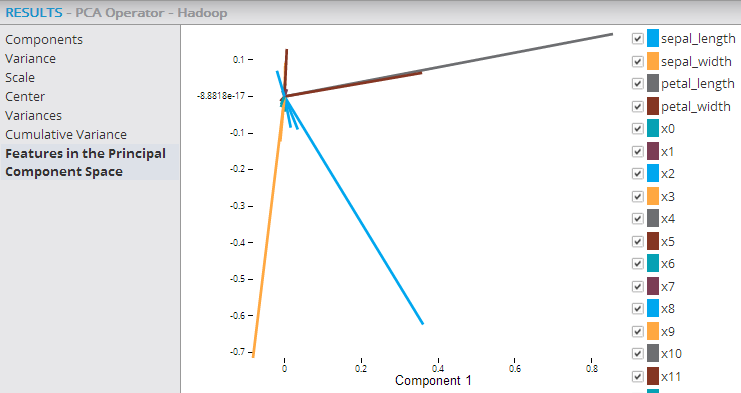
- Features in the Principal Component Space
- This graph provides a visualization of the source variables' (columns) axis from the original data space into the two-dimensional space spanned by the first and second principal components. As a result, those variables (columns) whose axes are near each other in the Principal component space have higher correlation to each other and the longer vectors (axes) have higher relevance in explaining the overall variance. In the example below, the three axes for sepal_width, sepal_length, and petal_length are the longest and most relevant to the datavariance. Also, the sepal_width and sepal_length variables are more closely correlated to each other than the sepal_length and petal_length are.
Note: To learn more about the visualization available in this operator, go to Explore Visual Results. - Data Output
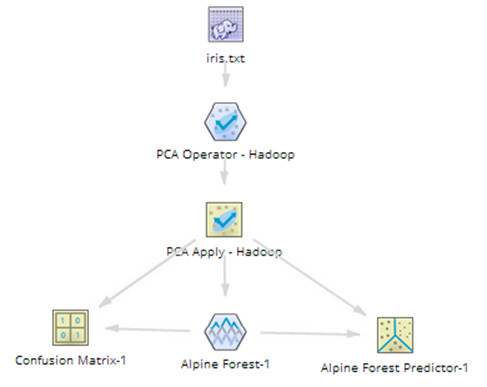
- The PCA Operator for Hadoop outputs the matrix transformation algorithm (not the transformed, reduced data set itself).
Note: To perform the transformation against a data set, the Hadoop PCA operator must be succeeded by a PCA Apply operator. The transformation can then be processed against the source training data set or a new input data set (with the same variables).
The following example shows the PCA and PCA Apply operators within a Hadoop workflow, with their output being passed into an Alpine Forest model.
See the PCA Apply operator for more details.