Cluster Analysis Using K-Means
One of the most well-known and commonly used partitioning methods for cluster analysis.
Cluster analysis is a method of predictive analytics based on assigning a set of objects into groups (called clusters) so that the objects in the same cluster are more similar to each other than to those in other clusters (in terms of their various attributes).
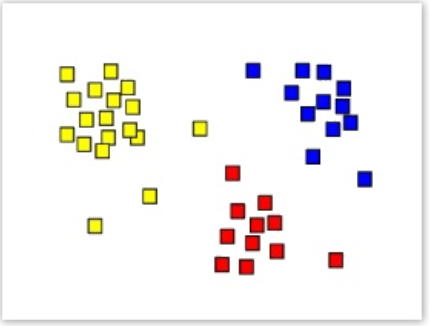
A fundamental type of cluster analysis is partitioning, which organizes the objects of a set into several exclusive groups or clusters. Given a dataset of n observations and a k number of clusters to form, the K-Means analysis organizes or "partitions" the data into the k specified number of clusters that minimizes the square mean distance of the members from the center of the cluster. For example, the following diagram shows the partitioning of a dataset into three sub-groups or "clusters", as indicated by their separate coloring.
When deciding whether to use the K-Means Operator, it is helpful to understand that clustering is an "undirected" or "unsupervised" data mining technique, meaning that since its goal is to discover the structure of the data as a whole, there is no target value to actually be predicted. Therefore, no distinction is made between dependent and independent variables for the K-Means Operator.
General Principles
Clustering techniques are used for combining observed examples into clusters (groups) which satisfy two main criteria:
This algorithm has as an input a predefined number of clusters, which is the k in its name.
Means stands for an average, an average location of all the members of a particular cluster.
When dealing with clustering techniques, one has to adopt a notion of a high dimensional space, or space in which orthogonal dimensions are all attributes from the table of data we are analyzing. The value of each attribute of an example represents a distance of the example from the origin along the attribute axes.
The K-means algorithm is a simple, iterative procedure, in which a crucial concept is the one of centroid.
The steps of the K-means algorithm[1] are:
- Select randomly k points (it can be also examples) to be the seeds for the centroids of k clusters.
- Assign each example to the centroid closest to the example, forming in this way k exclusive clusters of examples.
- Calculate new centroids of the clusters. For that purpose, average all attribute values of the examples that belong to the same cluster (centroid).
- Determine whether the cluster centroids have changed their "coordinates". If yes, start again from step 2). If not, cluster detection is finished and all examples have their cluster memberships defined.
Usually this iterative procedure of redefining centroids and reassigning the examples to clusters needs only a few iterations to converge. The K-Means algorithm computes a quality measure to optimize for the model which is calculated as follows:
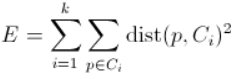
where k is the number of clusters, p is a member of cluster Ci, and dist is the distance of p from the center of Ci cluster.
Analyzing K-Means Results
Once the cluster analysis is completed, the clusters need to be interpreted in order to have some real value for a data mining project.
Overall, after analyzing the various K-Means Operator results output, the modeler/business user might then decide to do one of the following:
- Refine the cluster analysis: for example, by choosing a different set of attributes, cluster points, k value, or distance calculation metrics.
- Use the cluster results holistically: the modeler might take the results of the K-Means analysis and use the information "as is". For example, cluster membership can be used as a label for a classification system. Interpreting the clusters from a business perspective (that is, most loyal customer cluster or violent criminal cluster) might be very informative for understanding what the naturally occurring clusters actually are.
- Target a specific cluster: based on the cluster results, it might make sense for a business to, for example, apply a marketing campaign to only a specific cluster of customers.
Run a Decision Tree or CART Classification Analysis: running a descriptive data mining technique, such as the Decision Tree or CART Operator, next based on the defined cluster groups might be useful for understanding the classification rules involved.
- K-Means Use Case
The K-Means operator is useful in analyzing various dataset types, including biological datasets (such as human genetic clustering, genotype assigning, sequence analysis, organism community analysis), medical data sets (such as tissue and blood clustering, IMRT segmentation), business and marketing data sets (such as market research clustering of the population of consumers, shopping cart item grouping, social network analysis), and social science data sets (such as crime analysis of hot spots of a similar crime and student/school clustering).