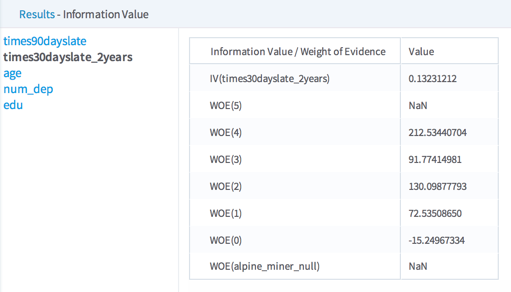
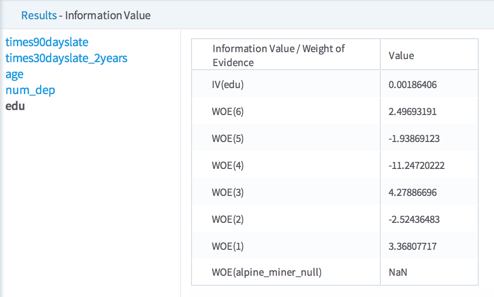
Information Value
Calculates both the information value (IV) and weight of evidence (WOE) of attributes. These are measures of the overall "relevance" of a data variable in predicting the dependent column's desired value or outcome.

Information at a Glance
For more information about IV and WOE, see Information Value and Weight of Evidence Analysis.
Algorithm
The Information Value operator uses the following formulas for calculating IV and WOE:
Weight of Evidence = Ln(Distribution Good/Distribution Bad)*100
Information Value = sum((Distribution Good - Distribution Bad)*Ln(Distribution Good/Distribution Bad))
where Distribute Good refers to percentage of values, for each given independent variable grouping, that results in the desired "Value to Predict" for the dependent variable and Distribution Bad is the percentage of values within each grouping that is not the "Value to Predict."
The following table provides an example.
| Attribute | Count Goods | Distribution Good | Count Bads | Distribution Bad | WOE |
|---|---|---|---|---|---|
| Missing | 1 | 10% | 3 | 30% | -109.9 |
| true | 3 | 30% | 2 | 20% | 40.55 |
| false | 6 | 60% | 5 | 50% | 18.23 |
Information Value = (10% - 30%)*Ln(10% / 30%) + (30% - 20%)*Ln(30% / 20%) + (60% - 50%)*Ln(60% / 50%) = 0.2785
Configuration
| Parameter | Description |
|---|---|
| Notes | Any notes or helpful information about this operator's parameter settings. When you enter content in the Notes field, a yellow asterisk is displayed on the operator. |
| Dependent Column | The column to use as the class variable.
Note: The Dependent Column must be a categorical (not continuous) variable. |
| Value to Predict | The value stored in the
Dependent Column that represents the event to analyze (for example, Active vs. Inactive).
The Value to Predict must be a value that exists for the Dependent Column. It is considered the "good" event. |
| Columns | Columns to use to analyze the relevance of or effect on the
Dependent Column value equaling the
Value to Predict.
Click Select Columns to open the dialog box to select the available columns from the input data set for analysis. See Select Columns Dialog Box for more information. Column names selected must be categorical values. |