Example 6: Estimating Drug Responsiveness (Half-Maximal Response)
A common problem in pharmacological research is to estimate an organism's responsiveness to a drug. A model (also discussed in the Introductory Overviews) that can be used to estimate the expected response at the point of saturation, and the concentration of the drug that produces a half-maximal response is:
y = b0 - b0/[1+(x/b2)**b1]
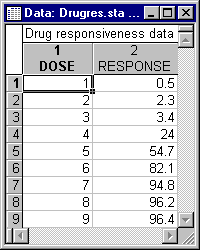
In this model, b0 is the expected response at saturation, b2 is the concentration for a half-maximal response, and b1 determines the slope of the function. Usually, the x values (concentration levels) are coded so that they are always larger than 1.0, and the y values are expressed as proportions of the maximum possible responsiveness to the drug. Neter, Wasserman, and Kutner (1985, page 489) present the following example data set.
- Specifying the analysis
- These data are contained in the file Drugres.sta. Open this data file by selecting Open Examples from the File menu (classic toolbar) or by selecting Open Examples from the Open menu on the Home tab (ribbon bar); it is in the Datasets folder.
From the Statistics - Advanced Linear/Nonlinear Models submenu, select Nonlinear Estimation to display the Nonlinear Estimation Startup Panel. Next, select User-specified regression, least squares on the Quick tab, and then click the OK button to display the User-Specified Regression, Least Squares dialog.
Click the Function to be estimated button to display the Estimated function dialog. In the Estimated function box, enter Response = b0 - b0/(1+(Dose/b2)**b1).
- Estimating the model
- Now, click the OK button in this dialog and again in the
User-Specified Regression, Least Squares dialog to display the
Nonlinear Least Squares Model Estimation dialog.
To estimate this model, on the Advanced tab click the Start values button to display the Specify start values dialog. Change the start value for b0 to 100. Since the other start values can remain at the default value of 0.1, click the OK button in the Specify start values dialog.
Finally, click the OK button in the Nonlinear Least Squares Model Estimation dialog to display the Results dialog.
- Reviewing results
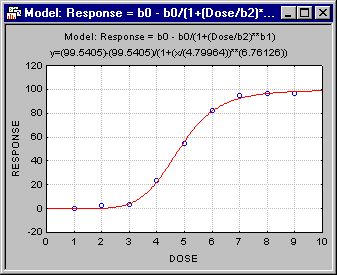
- Now, click the Fitted 2D function & observed vals button on the
Quick tab to see how well the specified function fits the observed data. The fit is almost perfect.
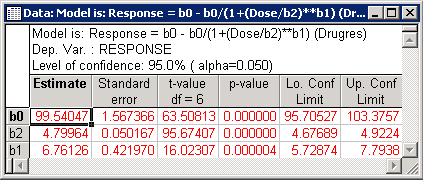
Click the Summary: Parameter estimates button to obtain the final parameter estimates.
In this example, the half-maximal response can be expected at a (coded) dose level of 4.80.


