Interactive Drill-Down Explorer Overview
Overview
How the Drill-Down Explorer Works
Auto-Updating Graphs and Summary Statistics after Each Drill-Down
Applications of the Interactive Drill-Down Explorer
Interactive Drill-Down Explorer vs. OLAP (On-Line Analytic Processing)
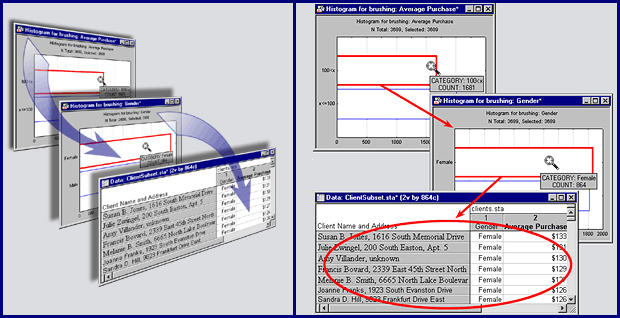
A first step of many data mining projects is to explore the data interactively to gain a first impression of the types of variables in the analyses, and their possible relationships. Statistica and Statistica Data Miner offer a large selection of methods for exploratory data analysis (EDA), as well as graphical data analysis (graphical or visual data mining). The purpose of the Interactive Drill-Down Explorer is to provide a combined graphical, exploratory data analysis and tabulation tool that will allow you to quickly review the distributions of variables in the analyses and their relationships to other variables, and to identify the actual observations belonging to specific subgroups in the data.
- A quick example
- For a more comprehensive, and technical illustration of this powerful tool see the next section, but for a quick introduction, consider the following, simple example. Imagine that you have data on Gender, Age, State, Product Ordered (A, B, or C), Income, and Education of all of your customers. The Interactive Drill-Down Explorer tool will allow you select variables of interest (e.g., all these listed here) and then interactively drill "through" them, for example, by simply clicking on specific bins of the respective histograms, in order to answer questions that can be as simple as:
"Are there more educated males or females in my sample?"
or as complex as:
"Is it true that only highly educated females, but those who are in low income brackets, buy product A, rarely B, and never C, and that this consistent pattern holds only for residents of the East Coast?"
How the Drill-Down Explorer Works
The drill-down metaphor within the data mining context summarizes the basic operation of the drill-down operation quite well: the program allows you to select observations from larger data sets by selecting subgroups based on specific values or ranges of values of particular variables of interest; in a sense you can expose the "deeper layers" or "strata" in the data by reviewing smaller and smaller subsets of observations selected by increasingly complex logical selection conditions (not unlike the case selection conditions available in Statistica).
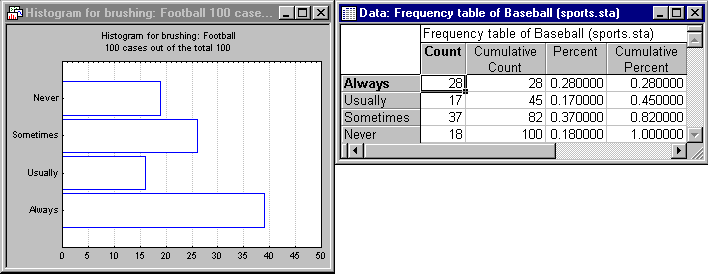
As a simple example (based on Statistica example data file Sports.sta), suppose you analyzed the results of a survey among patrons of sports bars and their self-reported preferences for different types of sports (see also Example 3, 4, and 5 of Basic Statistics Crosstabulation Tables). Respondents expressed their preferences regarding different types of sports by indicating how interested they are generally in watching the respective type of sport; the corresponding values (labels) Always, Usually, Sometimes, and Never were then entered into a data file. A simple histogram for the reported interest in Football may look like this:The histogram (bar graph) shows that 39 individuals reported that they Always are interested in watching Football. The frequency table for another popular sport - Baseball - is also shown above.
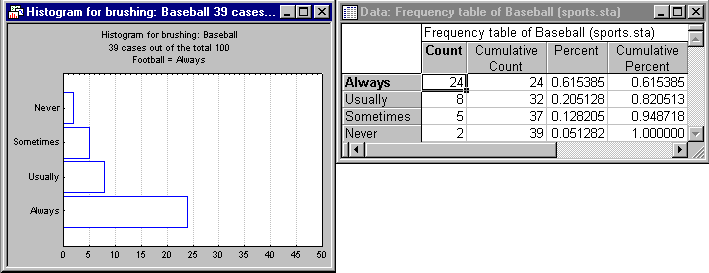
Now suppose you want to select the 38 individuals who reported strong interest in watching Football (represented by the column labeled as Always), to further "examine" them. The Drill-Down Explorer allows you to highlight that column, drill down, and then review various statistical and graphical summaries for other variables also recorded in the data set, but only for the selected cases. For example, after drilling down on column Always, the results may look like this:
Note how the frequency table for Baseball is automatically updated to reflect the frequencies for the selected category Football-Always. You could now drill down further by selecting only those respondents who also reported they were Always interested in Baseball, and so on.
- Categorical and continuous variables
- The nature of the variables selected for the drill-down operation can be categorical or continuous. For categorical variables the categories to choose from for the next drill-down operation are (usually) directly available in the data (e.g., a variable Gender with categorical values Male and Female); for continuous variables a number of different methods for dividing the range of values into categories are available: you can request a certain number of categories into which to divide the range of values in the continuous drill-down variable, you can specify the step size for consecutive categories, or you can specify specific boundaries for the continuous drill-down variables. For example, for a continuous variable Income, you could set up specific (income) "brackets" of interest to your project, and then drill down on those brackets to review the distributions of variables within each bracket.
- Exposing individual observations
- At any step you may want to "extract" the cases (respondents) belonging to the current subset. For example, if the data set contained the respondents' addresses, you could extract the individuals who are clearly strongly interested in Football and Baseball (Football=Always and Baseball=Always), and promote a special event to those individuals in a mail-out.
- Drilling "up"
- The interactive nature of the Drill Down Explorer allows you not only to drill down into the data or database (select groups of observations with increasingly specific logical selection conditions), but also to "drill up": at any time you can select one of the previously specified variable (category) groups and de-select it from the list of drill-down conditions; while processing the data the program will then only select those observations that fit the remaining logical (case) selection conditions, and update the results accordingly.
Applications of the Interactive Drill-Down Explorer
The example described in the How the Drill-Down Explorer Works section is very simple, exposing only the basic functionality of the program. The real power of the Statistica Interactive Drill-Down Explorer lies in the various auxiliary results that can automatically be updated during the interactive drill-down/up exploration: you can select a list of variables for review and compute for the selected cases:
- Descriptive statistics and frequency tables;
- Box-and-whiskers plots summarizing the distributions of continuous variables;
- Scatterplot matrices summarizing the relationships between continuous variables;
- All of the other statistical and graphical analyses available in Statistica by extracting the observations belonging to the current subset;
So for example, you could review the types of purchases that customers made with different demographic characteristics; study the effectiveness of certain drugs within different treatment groups, ages, etc.; or extract likely customers for a new product from a database of previous customers based on careful study of apparent (market) segments exposed by the drill-down analysis.
Interactive Drill-Down Explorer vs. OLAP (On-Line Analytic Processing)
On the surface, the operation of the simplest aspect of the Interactive Drill-Down Explorer (exploration of multidimensional tables) is very similar to the functionality offered by designated OLAP tools. OLAP tools allow users to quickly query a database to extract observations and summary information about those observations taking advantage of the optimized OLAP Server facilities offered for a specific database platform (e.g., Oracle, or MS SQL Server), and often providing significant performance advantages over tools based on traditional (non-OLAP driven) query tools. However, the main advantages of Statistica Interactive Drill-Down Explorer over OLAP are:
(a) its tight integration with Statistica's flexible categorization tools and exploratory environment (the analytic capabilities provided in the Statistica Interactive Drill-Down Explorer are much more comprehensive and general than typical OLAP tools, supporting flexible "drill up" operations, and allowing you to quickly review custom, complex summary graphs, detailed descriptive statistics, etc.), and
(b) the fact that the Statistica Interactive Drill-Down Explorer is not limited to any particular database platform and does not require a designated OLAP Server to be present (e.g., it can operate directly on Statistica data files). At the same time, by connecting to the Statistica application a (remote) database for in-place processing (see Streaming Database Connector Technology), you can efficiently perform drill-down operations on any data source, regardless of whether or not designated OLAP tools are available on the server.


