Plot: Spreads
Selecting the Plot: Spreads tab in the Graph Options dialog box is one way to access the options described here. Use these options to customize various display characteristics (line colors and patterns, fill colors and patterns, etc.) of the components that make up box and whiskers type plots.

See also the Graph Options dialog box - Plot: Box/Whisker tab topic for a description of the options for assigning particular statistics to the components of these graphs.
- Plot
- Use the Plot box to select the plot to which you want to make changes. If you have several plots in one graph, you can assign names to each plot using the Name box on the Plot: General tab.Note:
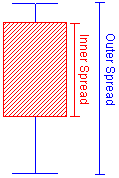
- Inner spread Use the options in the Inner spread group box to customize the appearance of the inner spread component of box and whisker-type graphs, i.e., in the default configuration, the appearance of the box in box and whisker plots. On plots that use the mean as the center point, the inner spread will display the standard error of the mean (mean ± SE) by default. On plots that use the median as the center point, the inner spread will display the interquartile range (75th percentile to the 25th percentile). Some graph types, such as means with error plots, have more options for adjusting the inner spread.
- Display inner spread
- Clear this check box if you do not want to display the inner spread, e.g., in order to turn off the box component in box and whisker type plots.
- Width
- In the Width box, select the desired width of the respective Type of spread. Note that this option is only available for range-type plots (e.g., plots created via 2D Graphs - Range Plots). To control the widths of the elements of standard box and whiskers plots, use the Width options (Box, Whisker) in the Graph Options dialog box, Plot: Box/Whisker tab.
- Type
- In the Type box, select how to represent the inner spread in the plot, i.e., the box components in default box and whiskers plots. Available options are Columns, Whiskers, Lines, and Rectangles. If Whiskers is the selected type, then the box next to this option is available to further specify the type of whisker; available choices in that box are Regular (as seen in the illustration above), High/Lo left, and High/Lo right (see also the illustration in the Graph Options dialog box, Plot: Bars tab topic).
- Line
- Click the Line button to display the standard Line Properties dialog box, which is used to specify the line pattern, color, etc. of the lines to be used when drawing the inner spread component of the respective box and whisker type plot.
- Area
- Click the Area button to display the standard Area Properties dialog box, which is used to specify the area pattern, color, etc. of the areas to be used when drawing the inner spread component (e.g., as Rectangles, see option Type above) of the respective box and whisker type plot.Note:
- Outer spread These options are equivalent to those described above for the Inner spread; however, the options in this group box pertain to the representation of the outer spreads in box and whisker-type plots, i.e., to the whiskers component in standard box and whisker plots. By default, for plots that are based on the mean, the outer spread displays the 95% confidence interval for the mean. For plots that are based on the median, the default is non-outlier range. Some graph types, such as means with error plots, have more options for adjusting the outer spread.
- Range borders and labels
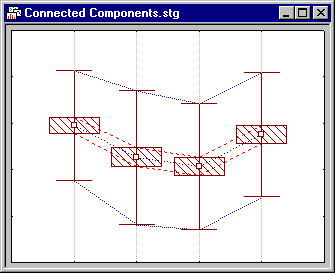
- Use these options to connect the respective components in box and whisker type plots, and to customize the respective line colors and patterns. These options are only applicable when more than one box-whisker icon is plotted in the graph.

- Inner border
- Select the Inner border check box to connect the inner spread components (e.g., the edges of the boxes) in the graph. Click the Inner border button to display the standard Line Properties dialog box, where you can select the color, size, and pattern for the connecting line.
- Outer border
- Select the Outer border check box to connect the outer spread components (e.g., tips of whiskers) in the graph. Click the Outer border button to display the standard Line Properties dialog box, where you can select the color, size, and pattern for the connecting line.
- Inner spread labels
- Select this check box to add labels to the inner spreads. The only values that are displayed are for the y coordinates.
- Outer spread labels
- Select this check box to add labels to the outer spreads. The only values that are displayed are for the y coordinates.
Copyright © 2021. Cloud Software Group, Inc. All Rights Reserved.
