Example 9: Exact Tests and Confidence Intervals for the Correlation Coefficient
Statistica Power Analysis includes a number of facilities for analyzing tests on the Pearson product-moment correlation coefficient. Statistica includes several different algorithms for calculating probabilities, including special routines for computing the exact distribution of the correlation coefficient under the assumption of bivariate normality.
Power and Sample Size Requirements of the t-Test for Zero Correlation. The most commonly performed hypothesis test is a test of zero correlation. Statistica Power Analysis provides extensive capabilities for analyzing power and sample size when testing this hypothesis.
For example, suppose you are testing the 2-tailed hypothesis that ρ = 0 against the alternative ρ ≠ 0, using the standard t-test. What will the power of the test be if N = 45, and the true correlation is .30? If the power is inadequate, what sample size is necessary to assure a power of .90?
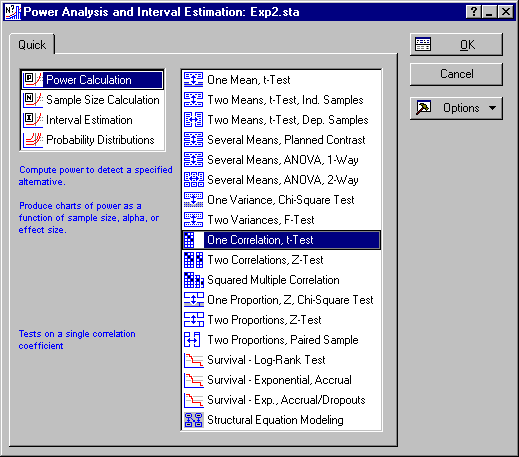
Ribbon bar. Select the Statistics tab. In the Advanced/Multivariate group, click Power Analysis to display the Power Analysis and Interval Estimation Startup Panel.
Classic menus. From the Statistics menu, select Power Analysis to display the Power Analysis and Interval Estimation Startup Panel.
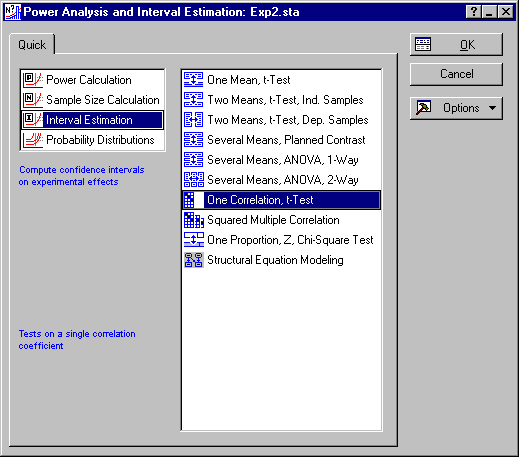
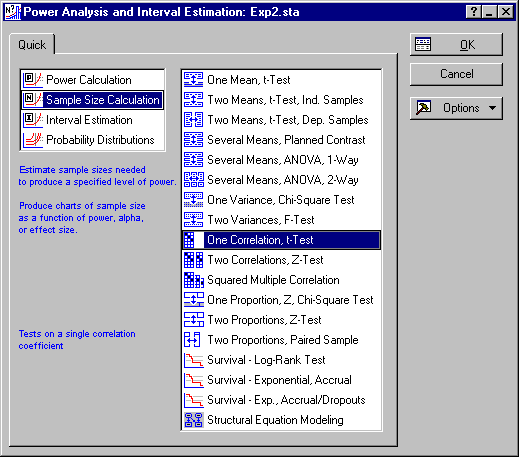
In the Startup Panel, select Power Calculation and One Correlation, t-Test.
Click the OK button to display the t-Test for Zero Correlation: Power Calculation Parameters dialog box.
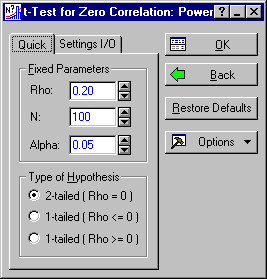
Enter .30 for Rho, 45 for N, and make sure that Alpha is set at .05 and the Type of Hypothesis is 2-tailed. Click the OK button to display the t-Test for Zero Correlation: Power Calc. Results dialog box.
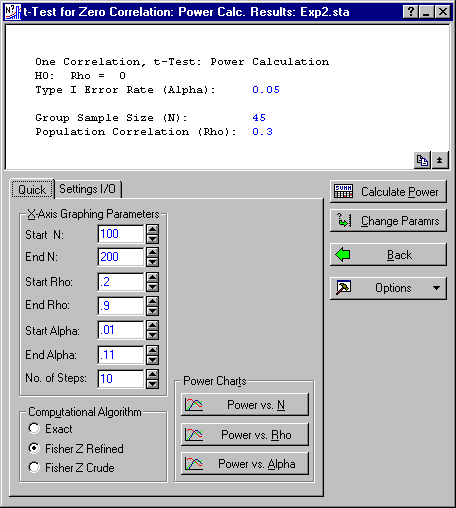
Click the Calculate Power button to calculate the power.
The default method of calculation is the Refined Fisher Z. This uses the Fisher transformation to approximate the exact distribution of the correlation coefficient, but uses series approximation formula to provide refined estimates of the moments of the Fisher transformation. These improved estimates provide increased accuracy over the traditional formula, which assumes, for example, that the variance of the Fisher transformation is 1/(N - 3).
For compatibility with other programs Statistica Power Analysis can use the crude Fisher transform, but it can also calculate the exact distribution of the correlation coefficient. The Refined Fisher Z provides an excellent balance between speed and accuracy, while the Exact method can be employed when sample size is very small and high accuracy is required.
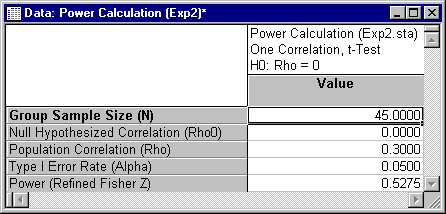
In this case, we find that power (.5275) is simply inadequate. The question then becomes, "how large a sample would be required to provide adequate power."
Go back to the Startup Panel by pressing the ESC key twice, and select Sample Size Calculation and One Correlation, t-Test.
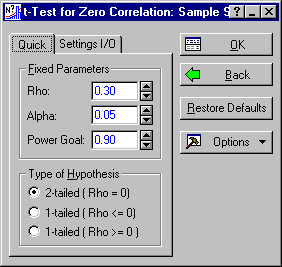
Click the OK button to display the t-Test for Zero Correlation: Sample Size Parameters dialog box. Note that the value for Rho is carried over from the preceding analysis.
Now, click the OK button to display the t-Test for Zero Correlation: Sample Size Calc. Results dialog box.
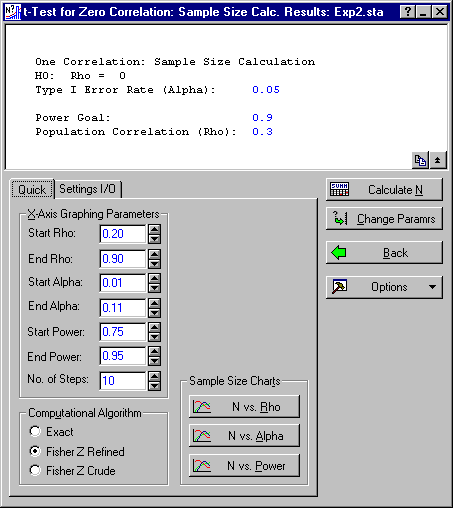
Click the Calculate N button to calculate the required sample size.
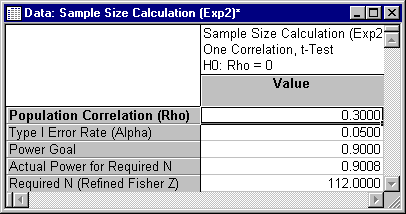
It turns out that the required sample size is 112, more than twice the original projection of 45.
- Exact Confidence Intervals
- Most standard texts present a confidence interval procedure for a single correlation that is based on the Fisher transformation. Statistica
Power Analysis can perform exact confidence interval estimation. Go back to the Startup Panel by pressing the ESC key twice, and select Interval Estimation and One Correlation, t-Test.
Click the OK button to display the t-Test for Zero Correlation: Interval Estimation dialog box. (In one sense, the dialog box is of course misnamed, as the interval estimation procedure itself does not use the t-distribution. However, the interval estimation procedure is frequently employed as an adjunct to the hypothesis test of zero correlation.)
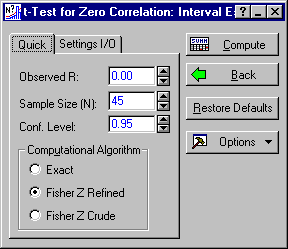
To construct a confidence interval, enter the Observed correlation, Sample Size, and Confidence Level, select a Computational Algorithm, and click the Compute button. Suppose, for example, you observe a correlation of .4431, with a sample size of 20, and compute a 95% confidence interval. In this case, it might be illuminating to compute the confidence interval using the standard method and compare it to the more refined methods.
Enter the values in the dialog box, and select the Fisher Z Crude option button under Computational Algorithm. The dialog box should now look like this:
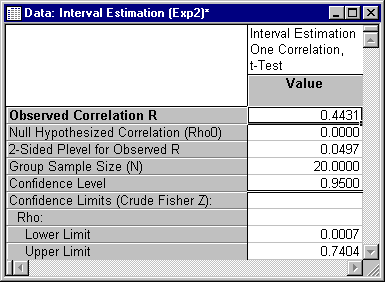
Click the Compute button, and observe the following result:
The spreadsheet includes a 2-sided probability level computed with the Fisher Z Crude method. Notice that the confidence interval excludes zero. Now return to the t-Test for Zero Correlation: Interval Estimation dialog and change the Computational Algorithm to Exact, and click the Compute button again.
The exact confidence interval includes the value zero, as indeed it should. The exact confidence interval (unlike the more commonly used method using the Fisher transform) will fail to include zero if and only if the t-test (2-tailed) of zero correlation rejects its null hypothesis.
- Exact Tests of the Hypothesis of a Specified Correlation
- When the population correlation ρ is equal to zero, the sampling distribution of r has a distributional singularity that leads to the standard t-test for zero correlation. When ρ is not equal to zero, the form of the distribution of r is substantially more complex. Consequently, most general-purpose statistics packages do not provide exact tests for hypotheses of the form
H0: ρ = a
for values of a other than zero.
Statistica Power Analysis provides exact calculations of the distribution of the Pearson correlation coefficient in its probability distribution calculator. In this example, we show how to use the calculator to provide an exact test and probability level of the hypothesis that
H0: ρ = 0.20
against the alternative
H1: ρ ≠ 0.20
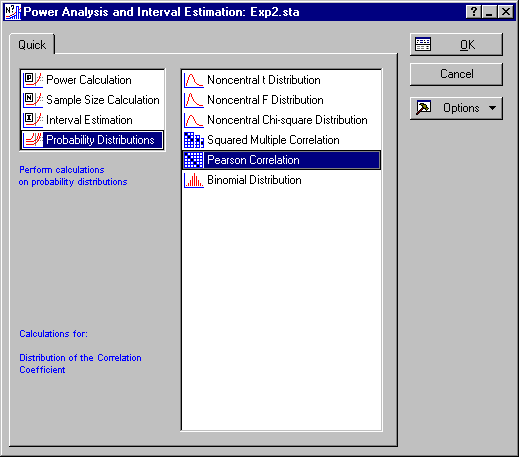
Begin by selecting Probability Distributions and Pearson Correlation from the Startup Panel (you can return to the Startup Panel by pressing the ESC key).
Click the OK button to display the Pearson Correlation: Power Calc. Parameters dialog box.
In this example, we will:
- Calculate the critical values of r for performing the 2-tailed test with a sample size of 100;
- Calculate the probability level of an observed value of r;
- Calculate the power of our test in the case where the true value of ρ is .40.
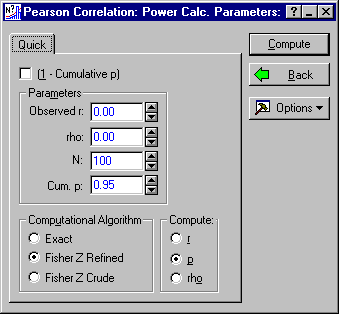
To calculate the critical values for a test with α = 0.05, we need to calculate the values of r that have cumulative probability values of .025 and .975. Enter 0.20 in the rho box, 100 in the N box, and .025 in the Cum. p box. Choose the Exact option button under Computational Algorithm and the r option button under Compute. The dialog box should look like this:
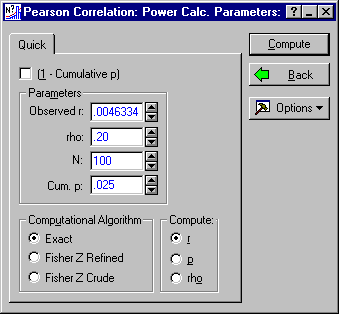
Click the Compute button, and observe the value of the Observed r. There will be a brief delay, as the computations for the exact distribution are fairly involved. You should then see a value of .0046334.
Now, change the Cum. p to .975, and click the Compute button again. You will observe a value of .3824093 in the Observed r box.
You have now computed the exact critical values for a test of the 2-tailed hypothesis that ρ = 0.20.
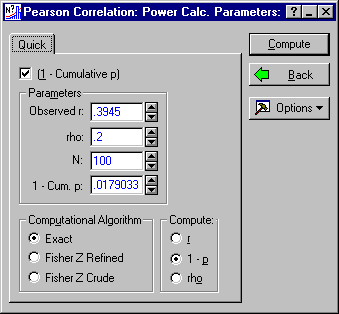
Imagine that you observe a correlation of .3945. What is the 2-tailed probability level for this value of r? The computation is rather straightforward with the Probability Calculator. Simply enter .3945 as the Observed r, select the (1 - Cumulative p) check box, select 1 - p as the quantity to compute in the Compute group, and then click the Compute button. The result should look like this:
The probability of obtaining a result greater than 0.3945 is .0179033. Doubling this gives the 2-tailed p-value, which in this case is .0358066.
Calculating the power of the 2-tailed test is only slightly more involved. We will proceed in three steps:
- Recalculate the lower rejection point under the supposition that ρ = 0.20, then calculate the probability of obtaining a sample correlation r less than the lower rejection point under the alternative that ρ = 0.40;
- Recalculate the upper rejection point under the supposition that ρ = 0.20, then calculate the probability of obtaining a sample correlation r greater than the upper rejection point under the alternative that ρ = 0.40;
- Add the probabilities from steps 1 and 2 together to produce the power.
Return to the Pearson Correlation: Power Calc. Parameters dialog box, and retrace the steps given above to calculate the lower rejection point. Click the button, and make sure that the values appear as follows:
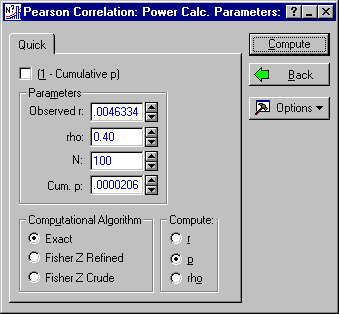
Next, change rho to 0.40, change the value to compute by selecting the p option button under Compute, and then click the Compute button.
As you might expect, this probability, which represents the chance of getting a rejection on the "wrong side," is very small - only .00002.
Next, repeat the steps involved in computing the upper rejection point. When you are done, the dialog box should look like this:
Next, we will compute the probability of obtaining a value higher than this rejection point. Select the (1 - Cumulative p) check box and enter 0.40 in the rho box. Select the 1 - p option button under Compute. Then, click the Compute button, and observe the resulting value in the 1 - Cum. p field. The dialog box should look like this:
Adding the probabilities from step 1 and step 2 together yields .5891761. The total power is thus .589.
See also, Power Analysis - Index.