Example 5: Mixed-Model Nested ANOVA Design
This example illustrates ANOVA and variance component estimation for a hierarchically nested random effects design. Unlike full factorial designs, in which every combination of every level of each factor occurs in the design, in nested designs each level of a nested factor occurs in only one level of the factor in which it is nested. Consider, as an example, students who have only one classroom teacher, and teachers who teach in only one school. In a study of the variation in achievement attributable to schools, to teachers, and to students, the student factor would be nested within the teacher factor, which in turn would be nested within the school factor. The design is hierarchically nested, because there is a hierarchy of nested factors.
Example 5 is based on a fictitious data set with three independent variables A, B, and C (coded in two different ways as described below) and a single dependent variable, Y. All three factors are considered to have random effects, and Factor C is nested within Factor B, which in turn is nested within Factor A, making the design a hierarchically nested random effects design (for details concerning mixed models see the Introductory Overview; see also the Variance Components and Mixed Model ANOVA/ANCOVA module topics and the Variance Components and Precision module topics). There are unequal N's for all three factors.
- Specifying the Analysis
- The data are available in the example data file Nested.sta. In the data file, B1 and C1 are coded with values identifying consecutive overall levels of the B and C nested factors, respectively, and B2 and C2 are coded with values identifying the levels within the other factors in which B and C are nested, respectively. A1 and A2 are coded identically. Thus, the two sets of factors merely represent different codings of the levels of the nested factors. We will first perform an ANOVA and estimate variance components for the factors in the hierarchically nested random effects design using the A1, B1, and C1 variables.
Ribbon bar. Select the Home tab. In the File group, click the Open arrow and select Open Examples to display the Open a STATISTICA Data File dialog box. The Nested.sta data file is located in the Datasets folder. Then, select the Statistics tab. In the Advanced/Multivariate group, click Advanced Models and from the menu, select General Linear to display the General Linear Models (GLM) Startup Panel.
Classic menus. From the File menu, select Open Examples to display the Open a STATISTICA Data File dialog box. The Nested.sta data file is located in the Datasets folder. Next, from the Statistics - Advanced Linear/Nonlinear Models submenu, select General Linear Models to display the General Linear Models (GLM) Startup Panel.
Select Nested design ANOVA as the Type of analysis and Quick specs dialog as the Specification method. Then click the OK button to display the GLM Nested Design ANOVA Quick specs dialog box.
Click the Variables button to display the standard variable selection dialog box.
Select Y from the Dependent variable list. Select A1, B1, and C1 as the Categorical predictors (factors), and then click the OK button.
In the GLM Nested Design dialog box, select the Options tab. Note that the Sigma-restricted check box under Parameterization is automatically unavailable. This is because the overparameterized coding of categorical predictor variables is always used for designs which include nested effects.
Now, click the Random factors button to display the Random Effects (Mixed Model) dialog box.
Select A1, B1, and C1 as random factors, and then click the OK button to close the dialog box and return to the GLM Nested Design ANOVA Quick specs dialog box.
For this example we will perform an ANOVA and estimate variance components using Type III sums of squares (the default method for decomposition of sums of squares when the overparameterized model is used).
To view the syntax program automatically generated from the specifications, click the Syntax editor button in the GLM Nested Design ANOVA Quick specs dialog box to display the GLM Analysis Syntax Editor.
The remainder of the specifications for this analysis can use the default specifications, so click the OK (Run) button in the GLM Analysis Syntax Editor or the OK button in the GLM Nested Design ANOVA Quick specs dialog box to perform the analysis. A dialog box may be displayed noting that the design is incomplete. Click the OK button.
Results.
- Type III estimates of variance components and ANOVA
- When the
GLM Results dialog box is displayed, select the
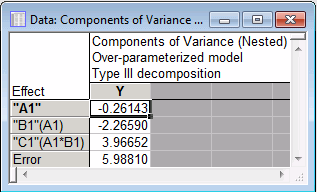
Summary tab. Under Random effects, click the Var. comps. button to create a spreadsheet containing the estimated components of variance for Y.
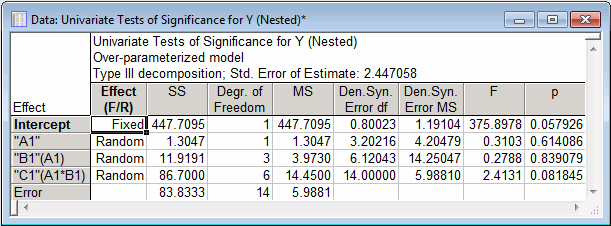
Next, click the All effects button to create the summary table for the mixed-model ANOVA.
To perform the same analysis using A2, B2, and C2 as the categorical predictor variables, click the Modify button to return to the GLM Nested Design ANOVA Quick specs dialog box. (Note that if you return first to the GLM Analysis Syntax Editor, click the < Back button to return to the GLM Nested Design ANOVA Quick specs dialog box. Click OK in the dialog box that notes changes to the syntax will be lost.)
Click the Variables button to specify A2, B2, and C2 as the categorical predictor variables.
Then, on the Options tab, click the Random factors button to display the Random Effects (Mixed Model) dialog box; specify A2, B2, and C2 as random factors, and then click the OK button.
Click OK in the GLM Nested Design ANOVA dialog box, and click OK in the information dialog box.
When the GLM Results dialog box is displayed, select the Summary tab. Click the Var. comps. button and the All effects button to produce the Components of Variance and Univariate Tests of Significance spreadsheets, respectively. You should find that the results are identical to those for the A1, B1, and C1 variables.
- Summary
- This example has shown how to estimate variance components for hierarchically nested random designs. Two methods of coding the nested factors were illustrated. The results are identical with both methods of coding, and indicate that the random factors do not significantly contribute to the variation on the dependent variable.
See also GLM - Index.


