Example 2: Illustration of EM Clustering with a synthetic data set
- Overview
- The purpose of this example is to illustrate the EM clustering method by creating a data file with known properties (number of clusters, types of distributions), and then analyzing that data file to extract those properties from the generated data. In a sense, we will be "putting into" the data a particular clustering solution and then attempt to extract that solution using the Cluster Analysis (Generalized EM, k-Means & Tree) module. This may help explain further the type of information that EM clustering will detect in the data. For details regarding the computations involved in k-means clustering, see also the Introductory Overview and Technical Notes.
- Creating the data file
- Begin by selecting New from the File menu and creating a data file with 3000 cases and 3 variables. After a blank data file has been created, select Batch Transformation Formulas from the Data menu to compute the values for the three variables as follows:
Then click OK to apply these formulas. The results will look (approximately) as follows:
The first variable will contain the three integer values 1 (cases 1 through 1000), 2 (cases 1001 through 2000), and 3 (2001 through 3000). Variable 2 will contain normal random numbers with (approximate) means and standard deviations 5 and 1 (cases 1 through 1000), 10 and 2 (cases 1001 through 2000), and 15 and 3 (2001 through 3000). Variable 3 will contain Poisson random numbers with (approximate) parameter values 5 (cases 1 through 1000), 10 (cases 1001 through 2000), and 15 (2001 through 3000).
- Specifying the analysis
- Open the Cluster Analysis (Generalized EM, k-Means & Tree) module by selecting that command from the Data Mining menu. In the
Cluster Analysis dialog box, select as continuous variables for the analysis Var2 and Var3. Then select EM as the Algorithm on the
Quick tab, and specify 3 in the Number of clusters field.
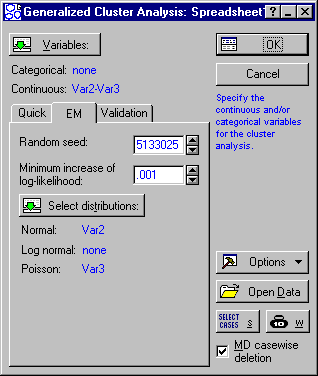
Click on the EM tab, and click the Select distributions button; then specify variable 2 (Var2) into the list of Normal variables, and variable 3 into the list of Poisson variables.
Now, click OK to begin the analysis, and after a few seconds the Results dialog will be displayed.
- Reviewing the distribution parameters for each cluster
- On the Results dialog, select the
Advanced tab, and click the Graph of distributions button.
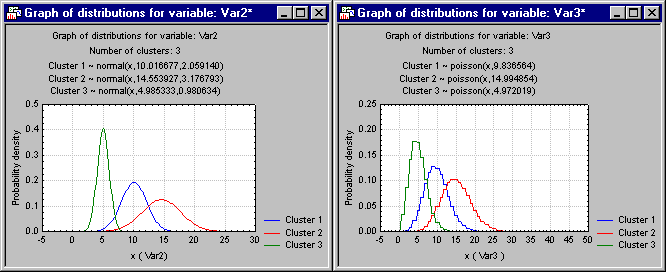
Shown above are the results for both variables Var2 and Var3. The final parameter estimates for the different distributions (for each cluster) are indicated in the header of each graph, which specifies the respective distribution functions depicted in each graph. As you can see, the parameters that we "inserted" into the data by generating random numbers from known distributions (with different parameters for each of the three clusters) are reasonably reproduced. In other words, the mixture of 3 normal and 3 Poisson distributions was successfully estimated from the data, and the clusters extracted as expected. This example illustrates further the basic "mechanism" of the EM clustering algorithm, as further detailed in the Introductory Overview.


