Alarm Trigger Workspace Node Example
Create a folder
| 1 | In Statistica , select the Enterprise tab. | |
| 2 | In the Enterprise group, click the Enterprise Manager icon |
StatisticaEnterprise Manager opens. |
| 3 | In the left hand tree view pane, expand the System View folder. | |
| 4 | Right-click the Statistica Enterprise folder and select New Folder. | if SDMS is turned on, the Enter a reason for this change dialog box will display. |
| 5 | If the Enter a reason for this change dialog box displays, enter a reason in the text box. | A form displays in the right pane of Enterprise Manger |
| 6 | Enter a name (Alarm Trigger Test) in the Folder name text box , and commit the changes (click Commit on the Enterprise Manger Home tab in the Changes group). | |
| 7 | Close Enterprise Manager. |
Add data source to Enterprise Manager


Create a database connection
| Select the Enterprise Tab and click the Enterprise Manager icon. | Statistica Enterprise Manager displays. | |
| 1 | On the Enterprise Manager ribbon, close the Statistica Enterprise folder, then click on the Database Connections icon in the left pane to select and expand it . | 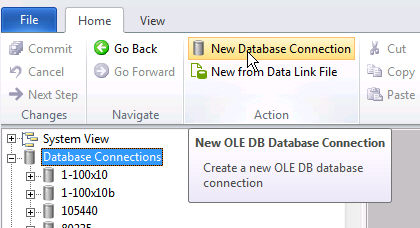
|
| In the Action group, click on the New Database Connection icon. | The Data Link Properties dialog box displays. | |
| 3 | On the Provider tab, select StatSoft OLE DB Provider for Statistica Spreadsheets. | 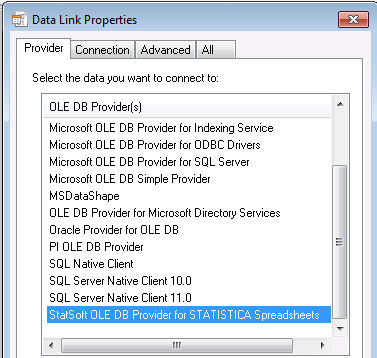
|
| 4 | Click the Next button. | The Connection tab will open. |
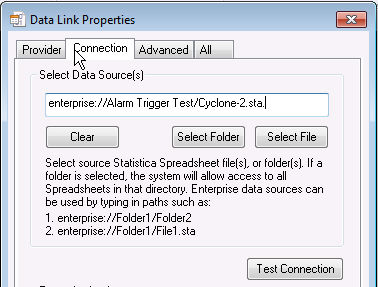
| 5 | In the Select Data Source(s) field on the Connection tab, enter the path to the newly added Cyclone-2 file, (enterprise://Alarm Trigger Test/Cyclone-2 4.sta). Note: Copying and pasting may not work. |
|
| 6 | Click the Test Connection button to ensure that the specified path is correct. | A prompt displays telling you that the connection succeeded |
| 7 | Click OK. | The prompt goes away. |
| Back in the Data Link Properties dialog box, click OK. | If SDMS is activated, you will be prompted to enter a reason for the change. The New Database Connection form displays in the right window. |
|
| 8 | In the Name textbox, replace the default name for the connection with Alarm Test Cyclone-2 | 
|
| 9 | Click Commit in the Changes group on the Statistica Enterprise Manager ribbon. | The Statistica Success dialog box displays the message, "Connection succeeded." |
| 10 | In the prompt about permissions, click Yes. | |
| 11 | Add read access permissions for Everyone. | |
| 12 | Click Commit again. |
Create a data configuration
| 1 | In Enterprise Manager, browse to the Alarm Trigger Test folder, right-click it, and select New Data Configuration. | |
| 2 | From the Connection drop-down list, select the newly created database connection to the Cyclone-2 data source. | |
| 3 | Enter a name for the data configuration: AT Cyclone-2. | |
| 4 | In the Queries section, click the New button. | |
| 5 | In the New Query 1 properties page, click the SQL Wizard button. | |
| 6 | In the New Query 1 - Statistica Query dialog box, select the Cyclone-2 item in the tree view pane, right-click it, and select Add. | The file is appended to the panel on the right. |
| 7 | Click inside the field with variable names, right-click, and select Select All Fields. | 
|
| 8 | Click the green arrow icon on the toolbar. | |
| 9 | In Enterprise Manager, enter a name for the query: Cyclone-2 Query. | |
| 10 | Click Commit. | |
| 11 | Add read access permissions for Everyone. | |
| 12 | Click Commit again. |
Create an Enterprise Data Configuration node in a workspace
| 1 | In Statistica , select the Data Mining tab. | |
| 2 | In the Tools group, select Workspaces > All Validated Procedures. | |
| 3 | In the Select Data Source dialog box, click Cancel | |
| 4 | Select the Data tab. | |
| 5 | In the Import/Export group, select Enterprise > Enterprise Data Configuration | An Enterprise Data Configuration node is added to the workspace
|
| 6 | Double-click the node. | The Enterprise Data Configuration dialog box displays. |
| 7 | Click the Browse button next to the Data Configuration field. | |
| 8 | In the Select Data Configuration dialog box, browse to the Alarm Trigger Test folder, select the AT Cyclone-2 data configuration, and click OK. | |
| 9 | In the Enterprise Data Configuration dialog box, select the Requery on run check box. | 
|
| 10 | Click OK. | |
| 11 | Right-click the node, select Rename, and rename the node Cyclone-2. | |
| 12 | Click OK. | 
|
Create a Rules node in the workspace
| 1 | In Statistica , select the Data tab, and ensure that the Cyclone-2 node is selected. | |
| 2 | In the Transformations group, click Rules Builder. | The Rules node is inserted into the workspace, and is connected to the Cyclone-2 node.
|
| 3 | Double-click the Rules node. | The Rules dialog box displays. |
| 4 | Click the Input Variables to Copy button, select all variables, and click OK. | |
| 5 | Click the Edit button. In the Rules Builder dialog box. | |
| 6 | Click [New node...], and select If() from the menu. | 
|
| 7 | In the Edit If Condition dialog box, type F. | 
|
| 8 | Select Flame temperature (°F) from the intellisense drop-down menu. | "Flame temperature (°F)" (with quotes) is displayed in the dialog box.
|
| 9 | Type in <=2100 after it. | 
|
| 10 | Click OK in the Edit If Condition dialog box. | 
|
| 11 | Double-click the child node below the If("Flame temperature (°F)"<=2100) condition, and select Variable=Formula from the list. | 
|
| 12 | In the Edit Formula dialog box, in the Variable field, type "Alarm ID" (with quotes). | 
|
| 13 | In the = Formula field, type "Too cold, increase temperature" (with quotes). | |
| 14 | Click OK. | 
|
| 15 | Double-click the [New node...] item under the If("Flame temperature (°F)"<=2100) condition. | 
|
| 16 | Select ElseIf() from the menu. | |
| 17 | In the Edit If Condition dialog box, type "Flame temperature (°F)">2864 and click OK. | |
| 18 | Double-click the child node below ElseIf("Flame temperature (°F)">2864) and select Variable=Formula from the list. | |
| 19 | In the Edit Formula dialog box, in the Variable field, type "Alarm ID" (with quotes). | |
| 20 | In the = Formula field, type "Too hot, reduce temperature" (with quotes), and click OK. | 
|
| 21 | Double-click the [New node...] item below the ElseIf("Flame temperature (°F)" > 2864) condition and select Else from the menu. | 
|
| 22 | Double-click the child [New node...] item below Else, and select Variable=Formula from the list. | |
| 23 | In the Edit Formula dialog box, in the Variable field, type "Alarm ID" (with quotes). | |
| 24 | In the = Formula field, type 5, and click OK. | An example value 5 that will later be used as the normal value for cases considered normal (not causing alarms) is assigned.
|
| 25 | Double-click the [New node...] item below the Else condition, and select Variable= Formula from the list. | 
|
| 26 | In the Edit Formula dialog box, in the Variable field, type "Dynamic Timestamp" (with quotes). | |
| 27 | In the = Formula field, type DTNow, and click OK. | This step creates a new variable - Dynamic Timestamp - that will be populated with the current system time (by the means of the DTNow function) every time the Rules node is run. This will keep generated alarms fresh if this variable is used for alarm generation [if a variable with a constant value is used, and generated alarms are acknowledged] on the corresponding dashboard in Enterprise Manager), the next run would not produce alarms, because they have been acknowledged before].
|
| 28 | Click OK in the Rules Builder dialog box. | |
| 29 | In the Rules dialog box, clear the Output Error variable check box. | 
|
| 30 | Click OK. |
Deploy the workspace to Enterprise
.
Configure a taskset
| 1 | In Enterprise Manager, browse to the Alarm Trigger Test folder, right-click it, and select New Taskset from the menu. | |
| 2 | Click the Add Task button next to the Tasks field. | |
| 3 | In the Select Analysis Configurations dialog box, browse to the Alarm Trigger Test folder, select the Cyclones workspace, and click OK. | |
| 4 | In the next dialog box, leave the Use same permissions as the Task check box selected, and click OK. | The new Cyclones analysis node (latest version) is added to the taskset. |
| 5 | In the properties page, click the Add button located under the Return codes from SVB analysis to be considered Alarm Events field. | |
| 6 | In the Add SVB Return Code dialog box, type Alarm ID = Too cold, increase temperature (no quotes), and click OK. | 
|
| 7 | Add another code: Alarm ID = Too hot, reduce temperature. | Note that, for the correct alarm generation, codes provided in this field must match the alarms text exactly, i.e., additional spaces, characters appended at the end (for example, if code had been copied from some location), or misprints might prevent some alarms from being recognized when an analysis runs via the dashboard. |
| 8 | Select the New Taskset node. In the Alarm Rules section, click the Add Rule button. | The New Rule 1 node is added to the taskset. |
| 9 | In the Conditions group box, from the Execute Action if drop-down list, select Any conditions are met | |
| 10 | In the same group box, click the Add button. In the Condition dialog box, click OK. | Any task causes alarm(s) is displayed in the Conditions field.
|
| 11 | In the Actions group box, click the Add button | |
| 12 | In the Choose an action dialog box, ensure that the Send an email option button is selected, and click OK. | |
| 13 | In the Send Email dialog box, enter your email address, and click OK. | Send email to [email address] is displayed in the Actions field. |
| 14 | Select the New Taskset node, rename the taskset to Cyclones Taskset, and Commit the changes. |
Configure mail notification
| 1 | In the Enterprise Manager tree view, browse to the System Options node, expand it, and select Mail Notification | |
| 2 | In the SMTP host field, type the name of your SMTP mail server. | |
| 3 | In the Default sender group box, select the Use explicit email address option button, and type your email address in the field below it. | |
| 4 | Commit the changes. |
Configure a dashboard
Copyright © 2021. Cloud Software Group, Inc. All Rights Reserved.