Example 1: Association Rules Applied to Consumer Preferences
This example is based on the FastFood.sta data file, which is also described in some detail in Example 6: Tabulating Multiple Responses and Dichotomies of Basic Statistics.
- Description of Data File
- Suppose you conduct a survey of consumer preferences of young adults. Specifically, you are interested in young consumers' 1) preferences for different types of fast food (favorite fast food), 2) preferences for different types of automobiles, and 3) actual (self-reported) past patronage of specific fast-food restaurants. In addition, you record the respondents' gender. These preferences are measured and entered into the data file FastFood.sta.
To illustrate the application of association rules, and the interpretation of results, in this example only respondents' gender and food preferences will be analyzed. The variables of interest in this example are identified and described below:
- Gender (simple categorical variable)
- The respondent's gender is recorded and entered as a categorical variable (Gender) into the data file (i.e., Male, Female).
- Favorite fast-food (multiple response variable)
- The questionnaire used for this study asks the respondents to select their favorite (up to) three choices of commonly available fast foods from a list of 8 different types. The 8 different types of fast food presented to the respondents are:
(1) Hamburger
(2) Sandwiches
(3) Chicken
(4) Pizza
(5) Mexican fast-food
(6) Chinese fast-food
(7) Seafood
(8) Other ethnic or regionally popular fast-food
The three choices that each respondent makes are entered into the data file as a multiple response variable, that is, their first choice is entered into variable Food_1 (first preference or favorite fast food), their second choice (if available) is entered into variable Food_2, and their third choice into variable Food_3 (see also Categorical Variables, Multiple Response Variables, and Multiple Dichotomies in Computational Procedures and Terminology for a discussion of variable types).
- Specifying the Analysis
- Open the data file FastFood.sta via the File - Open Examples menu; it is in the Datasets folder. Select Association Rules from the Data Mining menu to display the
Association Rules Startup Panel, and click on the
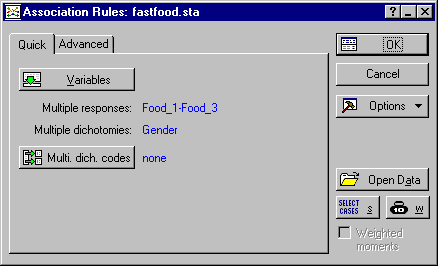
Quick tab. Click the Variables button and select Food_1 through Food_3 as the Multiple response variables; select Gender as the Multiple dichotomy/categorical vars.
There is no need to select the actual codes since the analysis will automatically pick up all distinct values found in the selected variables.
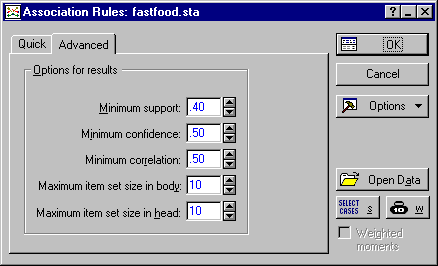
Next, click on the Advanced tab to specify the parameters that will guide the a priori algorithm for identifying the association rules (see Agrawal and Swami, 1993; Agrawal and Srikant, 1994; Han and Lakshmanan, 2001; see also Witten and Frank, 2000); to learn more about these parameters, see Computational Procedures and Terminology.
For this example, change the Minimum support value to .4, and leave all other options at the defaults. In general, you may always want to start with the default settings for these parameters. If no association rules satisfying these conditions (i.e., with the required Minimum support, Minimum confidence, Minimum correlation, etc.) can be found in the data, STATISTICA will issue a warning to that effect. You can then gradually relax these conditions, i.e., require lower Minimum support, Minimum confidence, and Minimum correlation, until a reasonable number of association rules can be derived.
The latter two parameters, Maximum item set size in body/head, are used to control the maximum complexity of rules derived from the data. Remember that in general, association rules have the form If Body then Head (see Association Rules: If Body then Head in Computational Procedures and Terminology ); so an association rule involving 10 items on each side of this rule would be quite complex (If X1 and X2 and ... X10 then Y1 and Y2 and .. Y10).
Now click OK to display the Results dialog.
- Reviewing Results
- The first thing you may want to review are the association rules in tabular form (see
Tabular Representation of Associations). Click the Association rules button on the
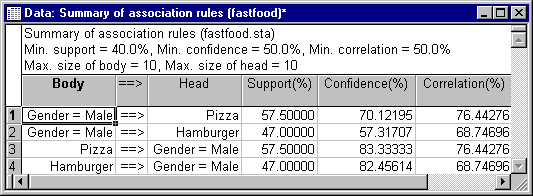
Quick tab to display this results spreadsheet. Note that you can use the standard Data - Sort options applicable to all spreadsheets, to sort the rows of this results spreadsheet by any of the numeric columns (Support, Confidence, Correlation).
We have four rules that associate males (Gender=Male) with certain food preferences:
- If Gender=Male then Pizza
- If Gender=Male then Hamburger
- If Pizza then Gender=Male
- If Hamburger then Gender=Male
The interpretation of these results - and this is one of the strengths of the association rules method in general - is rather apparent: Males like Pizza and Hamburger (in this sample).
- Rule Network, 2D
- Next click the Rule network button to review the graphical summary of the association rules.
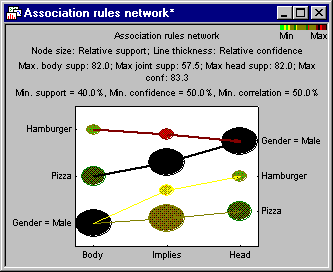
As discussed in Graphical Representation of Associations, the 2D association rules network provides a summary of all important information regarding the rules derived from the data. Remember that association rules follow the general form If Body then Head, where Body and Head are categories, items, text values, or conjunctions of categories, items, and text values. In this graph, the items identifying the Body of each rule are shown on the left side of the graph, the Head of each rule is shown on the right. The lines connecting the Body to the Head represent the association rules.
The support values for the Body and Head portions of each association rule are indicated by the sizes and colors of each circle (see also Computational Procedures and Terminology). The thickness of each line indicates the confidence value (joint probability) for the respective association rule; the sizes and colors of the circles in the center, above the Implies label, indicate the joint support (for the co-occurrences) of the respective Body and Head components of the respective association rules.
It is easy to see how all relevant statistics that describe the association rules are efficiently summarized in the sizes of circles, lines, and colors in this graph (see also section on Association Rules Networks, 2D in Graphical Representation of Associations for a more complex example graph related to text mining).
- Rule Network, 3D
- Next click the 3D Rule network button. The same information will now be shown in a 3-dimensional display.
As in the 2D association network, the support values for the Body and Head portions of each association rule are indicated by the sizes and colors of each circle in the 2D plane (see also Computational Procedures and Terminology). The thickness of each line indicates the confidence value (joint probability) for the respective association rule; the sizes and colors of the "floating" circles plotted against the (vertical) z-axis indicate the joint support (for the co-occurrences) of the respective Body and Head components of the association rules. The plot position of each circle along the vertical z - axis indicates the respective confidence value. Again, the rules relating Gender=Male to Pizza and Hamburger are clearly visible in this graph.
- 3D Histograms of Support, Confidence, and Correlation
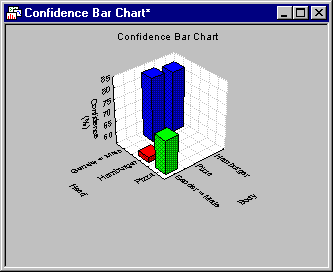
- You can also create 3D histograms summarizing the values for Support, Confidence, and Correlation. Shown below is the graph for Confidence. To create this graph, click the Confidence graph button on the
Advanced tab.
This graph shows, for example, that the confidence value (conditional probability) for the rule If Pizza then Gender=Male is relatively low (compared to the other rules).
- Summary
- This example illustrated the basic "mechanism" of applying association rules to identifying relationships between variables, items, responses, etc. This method is particularly well suited for data and text mining tasks of large data sets. The results, when clear results can be derived (i.e., when clear associations are present in the data), are always easily interpretable, understandable, and deployable, because they consist of very simple if - then rules.

