K-Means Clustering Results Advanced Tab
To access the options described here, select the Advanced tab of the k-Means Clustering Results dialog box.
| Options | Description |
|---|---|
| Summary: Cluster means & Euclidean distances | To display two spreadsheets, click the
Summary: Cluster means & Euclidean distances
button:
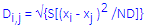
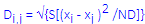
Specifically, this matrix shows the Euclidean distances between clusters, computed from the respective cluster means on the dimensions used for the classification. The distance between two objects or cluster centers i and j are computed as: where the summation is over the ND dimensions in the current analysis. |
| Analysis of variance | The goal of the k-means clustering procedure is to classify objects (cases or variables, depending on the selection in the
Cluster box in the
Cluster Analysis: K-Means Clustering
dialog box) into a user-specified number of clusters. To evaluate the appropriateness of the classification, you can compare the within-cluster variability (small if the classification is good) to the between-cluster variability (large if the classification is good). In other words, you can perform a standard between-groups analysis of variance (ANOVA) for each dimension (case or variable).
Click the Analysis of variance button to display a standard spreadsheet with these ANOVAs. Note that although the F ratios and p-levels are given in the table, statistical significance should be interpreted with caution since their meanings are not the same as in an actual ANOVA of experimental data (see the Cluster Analysis Overviews). In short, these are not a priori tests, and we capitalize on chance by arranging the most statistically significant ANOVAs possible (see Hartigan, 1975, for a more detailed discussion of this point). |
| Graph of means | To display a line graph of the means across clusters, click the Graph of means button . This plot is very useful for visually summarizing the differences in means between clusters. |
| Descriptive statistics for each cluster | To display spreadsheets, one for each cluster, containing the descriptive statistics click the Descriptive statistics for each cluster button. |
| Members of each cluster & distances | To display the (Euclidean) distances of the objects (cases or variables, depending on the selection in the Cluster box in the Cluster Analysis: k-Means Clustering dialog box) from their respective cluster center (mean), click the Members of each cluster & distances button. This enables you to identify potential "bad" cluster members, that is, objects that are very distant from the cluster center, yet apparently do not belong to any other cluster (that is, they are even further away from the centers of alternative clusters). These distances will be displayed in standard spreadsheets, each spreadsheet showing the results for one cluster. |
| Distances | The distance between two objects or cluster centers i and j are computed as:
where the summation is over the ND dimensions in the current analysis. Note that these distances are computed from raw (not scaled) data value; consequently, variables in the analyses with a large range of values may contribute disproportionately to the computed distances and, hence, the final cluster solution; see also, Differences in k-Means Algorithms in Generalized EM & k-Means Cluster Analysis vs. Cluster Analysis. |
| Save classifications and distances | To display a data file containing classification information and distances for clustered objects in a standard STATISTICA spreadsheet (shown in an individual window, regardless of the settings on the Options dialog box - Output Manager tab or the Analysis/Graph Output Manager dialog box), click the
Save classifications and distances button.
If you are clustering variables, the data file contains one case for each variable clustered; the original names of each clustered variable are used as case names. Three variables are created and named: Variable - the ID number of each clustered item (variable) as it appeared in the original input data set, Cluster - the cluster number to which each item (variable) was classified, and Distance - the distance of that item (variable) from its respective cluster center. If you are clustering cases, a standard variable selection dialog box is displayed to give you the option to save any of the variables that is, their raw values) from the current data file along with the cluster information. If the original input data file contained case names, then they will also be used to label cases in the new file. In addition to the (optional) variables selected from the original data file, the new data file will contain three variables: Case_No - the consecutive ID number of each clustered item (case) as it appeared in the original input data set, Cluster - the cluster number to which each item (case) was classified, and Distance - the distance of that item (case) from its respective cluster center. You can add the spreadsheet to a workbook or report using the or buttons. Note that in order to save the spreadsheet, you must select the spreadsheet and then select Save or Save As from the File menu. |