Principal Component Analysis (PCA) and Partial Least Squares (PLS) Technical Notes
- Principal Component Analysis
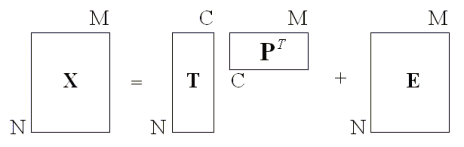
The aim of Principal Components Analysis (PCA) is to reduce the dimensionality of a set of variables while retaining the maximum variability in terms of the variance-covariance structure. In other words, PCA tries to explain the variance-covariance structure of a data set using a new set of coordinate systems that is lesser in dimension than the number of original variables. Given a set of M variables, say X, a principal component (PC) model transforms these variables into a new set lesser in dimension, i.e., C < M, and yet can capture most of the variability in the original data set. Each coordinate in the new transformed system is known as a principal component and, hence, the name Principal Component Analysis. A schematic of a 2-dimensional PC model (i.e., a model with two PCs) used to represent a three-dimensional data X is shown in Figure 1.

- Figure 1
- A schematic of a three-dimensional data (to the left) represented by a two-dimensional principal component (to the right).
PCA is a technique of great practical importance in many applications of statistical inference, most notably when we are faced with the problem of relating a large number of independent variables with a number of dependent outcomes without having enough observations to carry out the analysis in a reliable way. In such cases, there is seldom enough data to make reliable inference due to the curse of dimensionality (Bishop 1995) resulting from the large number of predictor variables. PCA alleviates this problem by mapping the original predictors into a set of principal components that is lesser in dimension than the number of the original variables. Such a transformation will usually be accompanied by a loss of information. The goal of PCA is, therefore, to preserve as much information contained in the data as possible. The optimal number of PCs needed to achieve this task is not known a priori. The task is to find a set of C principal components with eigenvalues that have a significantly larger value than the remaining M – C. This procedure requires the definition of a threshold for the retrieved eigenvalues beyond which the rest of the PCs are regarded to be insignificant. In other words, we discover an effective number of variables in the PC model that explains the original data sufficiently well. This is known as the intrinsic dimensionality.
Given a PC model, we hope to be able to interpret the first few principal components in terms of the original variables, and thereby have a greater understanding of the data. However, just as many methods of statistical inference, the application of PCA requires a preprocessing stage in which the original variables are transformed in a way that the general assumptions about the data set will hold best. This is known as preprocessing.
- Preprocessing
In multivariate analysis, variables often have substantially different ranges (i.e., different variances). This may have to do with the units of measurements or simply the nature of the variables themselves. However, the numeric range of a variable, among many, may not be a good indication of how important that variable is.

- Figure 2
- Demonstrates the superficiality of variance in an unscaled data set (red circles). Although x1 seemingly contributes little to the variability of the data (along the x-axis), as compared to variability of x2 (along the y-axis), the scenario is dramatically changed when data scaling is applied (blue circles). In this case we see comparable contributions to variance from both variables in the direction of their respective axis.
Figure 2 shows the scatterplot of a simple multivariate data set with two variables. Due to differences in scaling, an immediate visual inspection of the original observations (red circles) provides us with the false impression that most of the variability in the data comes from the second dimension x2. However, if we rescale the variables appropriately (blue points), it will instantly become clear that variable x1 adds as much variability to the data set as x2. Thus, it is always necessary to rescale variables of a multivariate data set in a way that no variable adds superficial variability to the problem just because of its scale.
From the above paragraph it is clear that the unit of measure may add some superficiality to the data that needs to be eliminated for various reasons. For example, in statistical modeling, such variables can bias predictions leading to bad models. More specifically, since in PCA the original variables are represented in a fewer number of dimensions while preserving maximum variability, it is clear that variables with larger ranges will be over-represented than others. This superficial influence often leads to faulty models. That is why scaling is so crucial in multivariate analysis.
- Mean Centering and Unit Variance
There are several ways to preprocess a data set, the most popular (and perhaps the simplest) of which is unit variance scaling. This type of preprocessing applies a linear transformation in which every variable in the data set is converted to a new one with unit variance. This transformation clearly provides the variables with an equal chance for representation by the PC model.
Another technique used is mean centering, which involves defining a new point of origin for the data given by the multivariate mean. It provides a convenient new point of reference for the transformed variables from which further analyses can be carried out (see Figure 3).
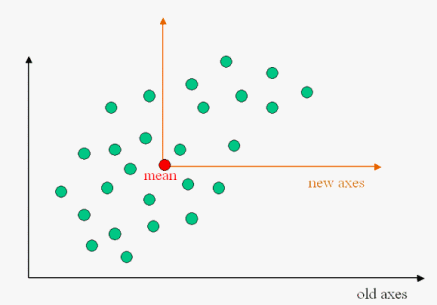
- Figure 3
- Shows data mean centering in two dimensions. Note that the mean of the multivariate data become the point of origin for the mean centered variables.
Mean centering and unit variance scaling are actually applied in one step in the form of a linear transformation defined as:

Using appropriate mathematical notation, we can rewrite the above as:

with

where xi, i = 1,...,N is a typical observation of the variable Xi, with mean
 and standard deviation
  . It is easy to show that the above linear scaling, also known as soft scaling, will transform the original variable Xi to
  which has zero mean and unit standard deviation.
In summary, scaling transforms variables of a multivariate data set in a way such that the variables become comparable in values, thus preventing variables with larger values from dominating those with smaller ranges and, hence, eliminating over representation of some variables merely on the basis of size. Equally important, mean centering will provide a new point of origin that can help with interpreting the model.
- PCA Revisited
Data preprocessing can be looked at, in many ways, as an integral part of PCA. While scaling helps to treat all variables equally, centering makes the interpretation of the model easier. After preprocessing, the next step is to find a number of principal components that represents the original variables X best in the least squares sense. In other words, we find a new coordinate system that predicts a matrix of observations
 as an approximation to X. This step is carried out incrementally; we start with extracting the first PC, i.e., the principal component that captures the largest portion of variability in X. Then we continue finding more components until we reach a point where the extracted PCs capture no less than a certain percentage of variability in the data set. Further elaboration of this technique will involve the user cross-validation methods (for more details, see The NIPALS algorithm for PCA section below).
- PCA in One Dimension (A Toy Model)
Now we will consider the simplest form of a PC model, consisting of a single principal component. Without loss of generality, let's assume for now that our data X is bivariate, i.e., contains only two variables. Such data can be represented using a single PC, i.e., C=1, which we denote by PC1. A diagram for PC1 is shown in Figure 4, where we can see that PC1 (a line) is passing through the mean of the multivariate data set X. Thus, by mean centering of X as part of the preprocessing step, we in effect created a point of origin for the new coordinate system (which in this case is defined by PC1). The orientation of PC1 is chosen in a way such that it captures maximum variability in the data. Each observation in the original data set xi = (x1, x2) can now be projected onto PC1. This projection of xi along the direction of PC1 is known as the score ti. In other words, ti is the new value of an observation in the new coordinate system. Thus, for a data set X with N observations, the score vector t = (ti,...,tN) uniquely defines the transformed data set.
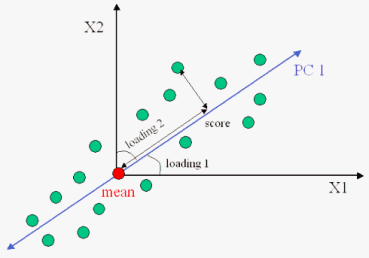
- Figure 4
- A schematic of a toy model consisting of a 2-dimensional data represented by a 1-dimensional PC model. The "mean" of the original data serves as the point of origin for the principal component and, as we should not forget, unit scaling give the variables a fair chance to influencing the PC model. The transformed value of an observation in X is given by its score, which simply measures its distance from the origin along PC1. Note that the orientation of PC1 is completely determined by its angles (loading factors) with respect to the old coordinate system.
The line defining PC1 takes its orientation with respect to the original variables in a way that it captures maximum variability in the data. The cosine of the angle between this line and a variable xi is known as the loading factor. It measures how well a variable loads into PC1, i.e., how much variable xi contributes to the PC model. Thus, given a set of M original variables, 2 in this case, the vector p = (p1 p2) uniquely defines the orientation of PC1 with respect to the original coordinate system.
- Extension to Multiple Dimensions
In the previous section, we represented a 2-dimensional data set with a single principal component. Depending on the dimensionality of X, however, this is not often the case. In most applications more than one principal component is needed to adequately capture the variability and, hence, the information in the data set.
In the simpler case of a two dimensional PC model, this projection is a point in the plane defined by the first and second principal components PC1 and PC2 (see Figure 1). More generally, a PC model finds a hyper-plane that approximates the data best. Note that in the new representation of the data set, the principal components are orthogonal, i.e., the angles between a component and the rest are 90°.
For multi-dimensional PC models, the set of principal components forms an orthogonal system with point of origin given by the mean of the original data and orientation defined by the loading factors,
where C is the number of PCs in the model and M is the number of variables in X.
While the matrix P defines the orientation of the principal components with respect to the old coordinate system, the t-scores matrix T defines the representation of the original observations in the new coordinate system,

Using the above, the predictions
of the PC model for the preprocessed data set  is then given by
  .
.- The Mathematical Model
In this section, we will look into some mathematical details of constructing PC models. Here we consider the representation of the original data set X with the aid of an arbitrary number of C (up to M) principal components. In matrix notation this representation can be written as:

where
is the preprocessed data and are the predictions of the PC model for . The noise matrix E gives the residuals, i.e., differences between and ,
The matrix
can also be written in terms of its vector components: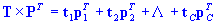
- Figure 5
- An algebraic representation of a PC model.
The loading factors are arranged in the order of the largest eigenvalues of the covariance matrix XXT.
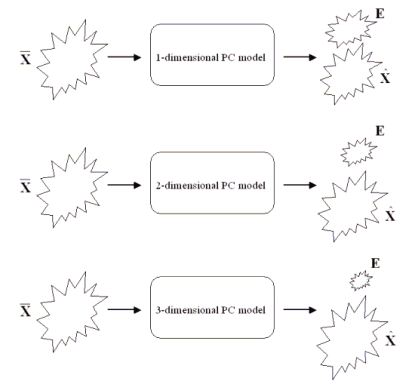
- Figure 6
- A progressive PC model with 1, 2, and 3 principal components. The more components we add to the model, the closer the prediction to , and the smaller the sum of square for error (i.e., the sum of squares of the elements of E).
At least in principle, the more components we add to a PC model, the smaller the elements of E (and surely their sum of squares) should become (see Figure 6). As we will see shortly, the matrix of residuals E plays an important role in detecting outliers that might be present in the data set X - a feature that can be used effectively for data inspection and diagnostics (see section 8).
The NxC dimensional matrix T contains the scores of the principal components in the new coordinate system. In other words, it consists of the coordinates of the original observations in the PC model. It is customary to arrange the scores such that t1 belongs to the principal component PC1, which captures variability more than t2, t3, ..., tC.

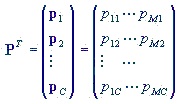
The matrix

has dimensions MxC and contains the loading factors of the principal components which geometrically determine the orientation of the principal components with respect to the original coordinate system and algebraically determines how well a variable will contribute to forming the scores. They also indicate how correlated the original variables are, as we shall discuss later.
- Data Diagnostic Using the PCA
In the previous sections, we learned that by just considering the loading factors and the scores, we can shed light on the importance of the original variables and their correlations, which can be used as a diagnostic tool for model interpretation. One more such tool offered by PCA is the residuals (see section 7). Again we reiterate that by residuals we mean the difference between the
data set and the predictions of the PC model . In other words, residuals are that part of that is not captured by the principal components.One of the advantages of PCA is its ability to diagnose the data on both observation and variable levels (Wold et al 1984 and Wold et al 1987). This diagnostic capability is inherent in the mathematical formulation of PCA and can be, therefore, utilized without further assumptions. Diagnostics on an observation level helps us to detect and identify outliers, which may be an indication of abnormalities. This plays an important role in process monitoring and quality control (see MSPC Technical Notes). Alternatively, diagnostics on the variable level helps us to decide how well the variables are represented by the principal components, the way they relate to each other, and their contributions to building the PC model.
Outliers are observations that do not fit the normal trend in the data set well. Strong outliers are detected by the value of their t-scores since they have the ability to pull the model toward themselves, and moderate outliers are identified using the residuals. One way of visualizing strong outliers is the Hotelling T2. T2 for observation i is given by:

where tik is the score of the ith observation for the kth component and
 is the estimated variance of tk. Note that ensures that each PC has an equal chance in calculating T2.
The Hotelling T2 is not sufficient for predicting outliers, especially with new observations, i.e., observations that were not present in the data set used to build the PC model. A better quantity is the Square of the predictions error SPE (Q) (see MacGregor and T. Kourti). For the ith observation SPE (Q) is defined as:
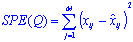
where xij and
 are the elements of and , respectively.
Moderate outliers do not have the power to pull the model toward themselves and cannot be easily detected with the Hotelling T2. An alternative approach is offered by the residuals (i.e., elements of matrix E). The residuals are used to detect the so-called distance-to-model (D-To-Model). A data case is labeled as an outlier if the corresponding value of its distance-to-model is found to exceed a given threshold value. For a typical observation i, the distance-to-model is calculated as:

where the degree of freedom DF is defined as the difference between the number of variables in X and the number of principal components,

The elements of the residual matrix E can also be used for data diagnostics on a variable level. For example, the importance of a variable is based on how well it is represented by the PC model. This is measured by the modeling power, which is defined as the explained standard deviation.

where SVj is the residual standard variation of the jth variable and
 is its initial standard deviation. Note that for scaled data with unit variance, is equal to unity for all variables in . A variable is completely relevant if its modeling power is equal to 1. Variables with low modeling power are of little relevance.
- Figure 7
- The scatterplot of the loading factors p1 and p2 for the first and second principal components. Variables v1, v3, and v4 are positively correlated since they are positioned on the same side (quadrant) of the plot. The relative location of these variables with respect to v2 also indicates that they are negatively correlated to the latter.
One of the useful diagnostic tools for exploring the role of the variables and their contribution to the PC model is the scatterplot of the principal components. The schematic in Figure 7 shows the scatterplot of PC1 and PC2 for a PC model with four variables. The fact that variables v3 and v4 are close (upper left section) means that they influence the PC model in similar ways. It also means that they are positively correlated. v1 also contributes to the PCA model in ways similar to v3 and v4. The further a variable away from the origin, the more influential that variable is. This means that v2 is less influential compared to the rest of the variables. This variable is also negatively correlated to v1, v3, and v4 (since it is positioned diagonally opposite of the upper-left quadrant where v3 and v4 are). This simply means that v2 contributes to the PC model in ways different from v1, v3, and v4.
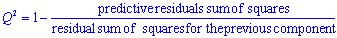
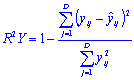
Other quantities useful for PC model diagnostics are the fraction of the explained variation R2X and the fraction of predicted variation Q2X. R2X is measured on the entire training sample using the formula:

The denominator is the residual sum of squares and the numerator is the total variation in the preprocessed data. For a PC model with, say, A components, the cumulative
 is given by:
where
 is the prediction of the PC model (with A components) for the ith observation of the jth variable. Using the above expression, the explained fraction of variation
  due to adding the next principal component can be written as:
The more significant a principal component, the larger its R2X. In general, a PC model with a sufficient number of components will have a value of R2X (cum) close to 1.
The predictive variation Q2 is mathematically identical to R2X except that it is measured using a sample of observations that was not used to construct the PC model,
Given a PC model with A principal components Q2 (cum) is defined as:
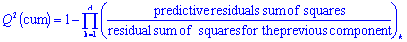
Unlike R2X, Q2 and Q2(cum) increases as we add more and more components to the PC model. However, this trend gives way to a decrease as we add more components beyond a certain point. The point of inflection in the value of Q2 provides an estimate of C (see section 10). Note that you can also define Q2(cum) and its cumulative for a single variable j,
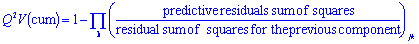
Q2V explains how well a variable is represented by the principal components.
- Limit and Significance of a Principal Component
In this section, we outline a criterion for measuring the significance of a principal component that we will later use in determining the optimal complexity of the PC model using the method of cross-validation (see section 11).
The Limit of the kth principal component is defined as the ratio of the degree of freedom DFk it consumes to the total degree of freedom of the PC model
 before it was added:
A principal component is regarded as significant if one of the following rules is satisfied:
- Q2 > Limit
- At least
 variables has Q2 V > Limit.
 - If neither of rules 1 nor 2 is fulfilled, a component is still regarded as significant should the proceeding one satisfy either 1 or 2.
In addition to the above rules, a principal component is regarded as not significant if the total number of components is greater than or equal to the floor(N/2) or floor(M/2), whichever is smaller.
- Model Complexity
The primary task of PCA is the representation of the original variables with a number of principal components C which is lesser in dimension than that of the data set X, i.e., C<M. In PCA, it is fundamental to ask "how many principal components should be in the model?" In this context, we can view the number of principal components as a nuisance parameter that needs to be estimated using a suitable method.
Any method used for determining C should take into account not only the goodness of fit but also the complexity taken to achieve that fit. In other words, when building PC models, we should strike a balance between the number of principal components and the ability to accurately predict data. A model with an insufficient number of components cannot predict the data accurately enough. A model with too many components has more components that it needs in predicting the data.
The trade off between model complexity and the goodness of fit is deeply rooted in the principal of Occam's razor (Sir William Of Occam 1285-1349), which states that if two models with different complexities explained the data equally well, we should then favor the simpler one.
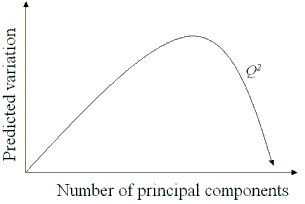
- Figure 8
- The variation of Q2 with increasing model complexity. The peak of this variation fixes the optimal number of components that should go into the PC model.
The quantity used to find the optimal complexity of a PC model is the predicted variation Q2. As we add more and more components to the PC model, Q2 increases. However, this trend will eventually give way to a decrease in Q2 if we keep adding more components beyond a certain point. The point of inflection in the value of Q2 provides an estimate of C.
- The Method of Cross-Validation
By calculating Q2 for PC models of increasing complexity, starting from 0, we can actually find the optimal number of principal components that achieves maximum Q2. STATISTICA implements this technique using either the method of v-fold or Krzanowski cross-validation.
In v-fold cross validation, the data is divided into v segments, v-1 of which is used to build the model and the rest is used for testing. This process is then repeated for all possible permutations of the training and testing segments and the overall Q2 and Q2V are calculated for the newly added principal component using the test samples. Given the estimated values of Q2 and Q2V, we can then determine, using rules 1-3 (see section 9), whether a principal component is significant.
In contrast to v-fold cross-validation, Krzanowski (Eastman and Krzanowski, 1982) does not partition the data into folds, but rather removes an entry for all entries one at a time, from the matrix
. This missing entry is treated by the NIPALS algorithm (see section 12) as missing data, and then the model is used to predict its value, which in turn is used for calculating Q2 and Q2V and, hence, the significance of the principal component in question.Whether using Krzanowski or the standard v-fold cross-validation, the above steps are repeated for an increasing number of principal components, starting from 0. For each extracted component, the test of significance is applied. This process is repeated until we can find nor more significant principal components to add to the model.
- The NIPALS Algorithm for PCA
The NIPALS algorithm is an iterative procedure used for constructing PC models for the representation of multivariate variables X using a number of principal components lesser in dimension than the number of the original variables. It is the most commonly used method for calculating the principal components and provides numerically more accurate results as compared to other methods such as the technique of decomposition of covariance.
The algorithm extracts one principal component at a time. Each component is calculated from the iterative regression of X onto the t-scores t, such that at each iteration a better loading factor p is found. The value of p is then used to improve the estimate of t.
As discussed before, we preprocess the original variables such that they have zero mean and unit (or user defined) standard deviation. This will yield the data matrix
, which will be used in all subsequent calculations.- To start the iterative procedure for extracting a component, we begin with a value of tk as the starting point. This initial value may be selected from a column of with the highest remaining residuals. Again, we reiterate that is the representation of the preprocessed data.
- Next we improve the estimate of the loading vector pk by projecting the Xk-1 on to the scores tk.
 and normalizing its length using
  .
. - Similarly we improve estimate of tk by projecting the matrix Xk-1 on the loading vector pk

- Using the kth score, we re-estimate the eigenvalues from:

- If the difference between the estimates of
 from two successive cycles were below a certain threshold, the algorithm has converged. If not, keep repeating steps 2 through 4.
 - Partial Least Squares
Partial Least Squares (PLS) (also known as Projection to Latent Structure) is a popular method for modeling industrial applications. It was developed by Wold in the 1960s as an economic technique, but soon its usefulness was recognized by many areas of science and applications including Multivariate Statistical Process Control (MSPC) in general and chemical engineering in particular.
It many ways, PLS can be regarded as a substitute for the method of multiple regression, especially when the number of predictor variables is large. In such cases, there is seldom enough data to construct a reliable model that can be used for predicting the dependent data Y from the predictor variables X. Instead, we get a model that can perfectly fit the training data while performing poorly on unseen samples. This problem is known as over-fitting (Bishop 1995). PLS alleviates this problem by adopting the "often correct" assumption that, although there might be a large number of predictor variables, the data may actually be much simpler and can be modeled with the aid of just a handful of components (also known as latent). This in fact is the same technique used by PCA for representing the X variables with the aid of a lesser number of principal components.
The idea is to construct a set of components that accounts for as much as possible variation in the data while also modeling the Y variables well. The technique works by extracting a set of components that transforms the original data X to a set of t-scores T (as in PCA). Similarly, Y is used to define another set of components known the u-scores U. The t-scores are then used to predict the u-scores, which in turn are used to predict the response variables Y. This multistage process is hidden, and all we see as the outcome is that for a set of predictor variables X, PLS predicts a set of relating responses Y. Thus, PLS works just as any other regression model.

- Figure 9
- A schematic representation of PLS analysis.
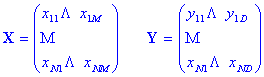
Just as before, both X and Y are matrices of data:
and it is assumed there is a relationship of the form:

which relates an observation in Y to the corresponding entry in X. The relationship f is not known a priori but can be modeled using PLS.
Just as in PCA, both the dependent and independent variables are preprocessed using scaling and mean centering (see section 2).
To build a PLS model, we need to regress the original data
onto the t-scores T, which are used to predict the u-scores U, which in turn are used to predict the responses Y. Thus:

where Q is the q-loadings and F is the matrix of residuals that models the noise. The above equations represent the so-called outer relations of the PLS model. In addition, there is also an inner relation that results from the interdependency of Y variables on X. As we shall see later, both the outer and inner relations can be built using the NIPALS algorithm (see NIPALS Algorithm for PLS, below).
Just as all regression models, it is the aim of PLS to minimize the residuals F as much as possible while also having a representation of the relationship between X and Y that generalizes well for unseen (validation) data. Because of the inner relationship, the principal components used for representing X and Y cannot be calculated separately. In other words, when building PLS models, the outer relationships should know about each other so they cooperate in building the model as a whole. This means that the outer relations cannot be separately handled but rather treated as parts of the same problem. This condition is fulfilled by rewriting the second outer equation as:

were B is the matrix of coefficients which relates the matrix of t-scores T to the matrix of u-scores U. In essence, TB defines an inner regression problem that relates the t-scores to the u-scores. In other words, T is used to regress U. In that sense, the elements of B are merely the regression coefficients.
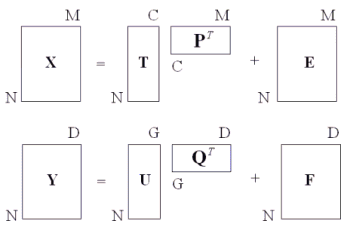
- Figure 10
- An algebraic representation of a PLS model.
Just as the X variables, the R2Y can also be defined for the Y variables from the fraction of the explained variance:
Similarly, you can detect outliers using distance-to-model defined for Y,
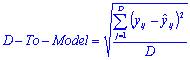
where D is the number of Y variables.
- NIPALS Algorithm for PLS
STATISTICA PLS uses the state-of-the art NIPALS algorithm for building PLS models (Geladi and Kowalski, 1986). The algorithm assumes that the X and Y data have been transformed to have means of zero. This procedure starts with an initial guess value for the t-scores u and iteratively calculating the model properties in separate and subsequent steps:
If t did not change (within a certain rounding error) between two successive cycles, the algorithm has converged. After convergence is reached, the p-loading factors are calculated and normalized from
 and
and  . Using the new value of p in an extra loop, we can then obtain the orthogonal values of the t-scores via
  .
.- Categorical Variables
Often we have to deal with variables that are in a discrete form. One example of such data is known as categorical, which does not lend itself to a natural ordering such as {1, 2, 3}, e.g., MALE and FEMALE or RED, GREEN, and YELLOW. Such variables can be represented using a 1-of-N coding scheme without imposing an artificial ordering. For example, if a variable consists of three categories - A, B, and C - then a natural representation of the variable would be (1, 0, 0), (0, 1, 0) and (0, 0, 1), depending on whether the outcome is A, B, or C, respectively. STATISTICA PLS uses this arrangement to represent categorical variables. It should be noted that, as in unit scaling for continuous inputs, the 1-of-N coding scheme is the most common form of preprocessing used for handling categorical variables.
- PLS for Classification Problems
STATISTICA PLS uses a 1-of-N coding scheme for handling categorical dependent variables. For a variable with N categories, this scheme creates N dummy variables, and the normalized outputs of the PLS model are interpreted as class membership probabilities (see section 15).
- Limit and Significance of a PLS Component
Rule 1: If Q^2 > limit (0 for PLS), the component is significant.
Rule 2: At least one dependent variable has Q^2V > limit (0). Q^2V is Q^2 for variables.