Conceptual Overviews - 2D Line Plots (Variables)
The 2D Line Plots dialog contains a selection of two-dimensional univariate and multivariate line plots. In line plots, individual data points are connected by a line. Line plots provide a simple way to visually present a sequence of many values (e.g., stock market quotes over a number of days); XY Trace line plots (see below) can be used to display a trace (instead of a sequence).
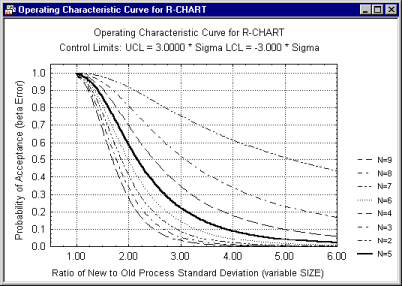
Line graphs can also be used to plot continuous functions, theoretical distributions, etc.
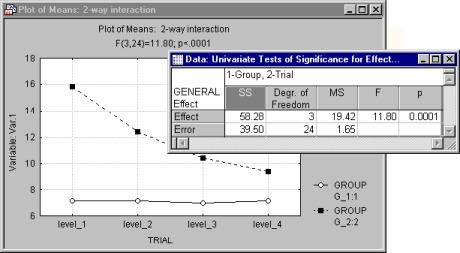
If there are only a few observations, then a vertical bar graph is usually better, although notable exceptions to this rule are plots of differences between means across a number of groups. Such plots are integrated into various modules of Statistica (e.g., integrated plots of interactions are built into the ANOVA, Basic Statistics and Tables, and other modules).
If there are very many observations in the sequence and if they are differentiated, then smoothing is necessary to uncover or expose the overall pattern of the data sequence. The simplest form of smoothing is aggregation, where instead of raw data, the means of consecutive sets of n observations are plotted. In aggregated line plots the ranges of values in consecutive segments are marked using whisker-type high-low marks.
Aggregation can also be used as a data reduction technique allowing one to present in one plot more data points than could otherwise be displayed (given the resolution of the monitor or the printer). For example, on most display monitors, even in high-resolution mode, the plotting area consists of no more than 500 vertical lines of pixels, thus series longer than 500 data points cannot be shown properly; aggregation can make long series much more readable on the screen.
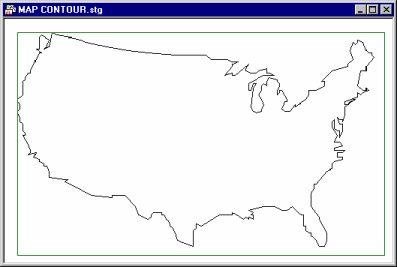
XY Trace Line Plot (Drawing Based on Coordinates)
Obviously, for interactive customization of graphs, the integrated on-screen drawing tools are much more convenient.
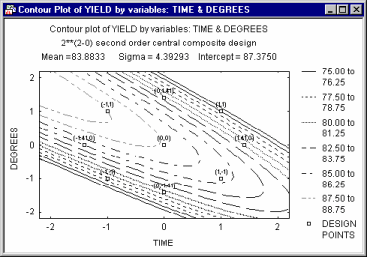
Line plots can also be used to draw contour-like computed projections of surfaces.
This method of generating contour plots is used in some modules of Statistica.


