How do I display a specific equation for the fitted function?
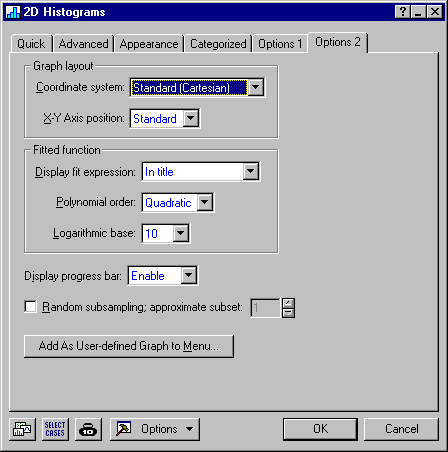
In Graphs menu graphs, the display of the text of the fitted function equations can be requested by selecting either In title or As custom text in the Display fit expression box on the Options 2 tab of the graph specification dialog box. Select Off in the Display fit expression box to suppress the display of fit equations.
In all single plot and non-categorized graphs where only one function is fitted, the text of the equation is displayed in the first available line of the fixed title. Depending on the number of equations to be displayed, also in categorized graphs, the equations can be displayed in the fixed titles of the graph.
However, if more equations need to be displayed than the number of lines available in the fixed title, then STATISTICA will create a custom text object on the graph and place the equations there. Potentially, such lists of equations can be very long (e.g., include 256 equations), and thus the custom text object can be large and partially cover the graph. However, the location of the listing of functions can be adjusted (the list can be moved around and edited like any other custom text object, the font size reduced, etc.).
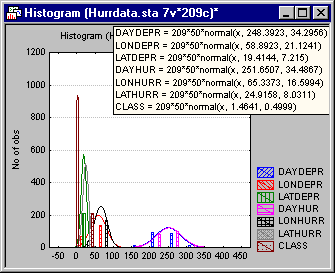
When the listing of functions is very long, it is recommended to add some space around the graph and place the text object there. You can add space around the graph using either the Adjust the graph actual size/scaling
![]() toolbar button or the Set graph area
toolbar button or the Set graph area
![]() toolbar button.
toolbar button.