Graphics Styles - Contents of Graphics Styles
Graphs are composed of collections of properties of graph objects; that is, they are collections of labels, axes, fit lines, point markers, etc., as well as separate added objects such as circles, text boxes, or arrows (e.g., size, color, thickness, and pattern of lines; size, shape, and color of point markers; colors and patterns used for definition of areas; size, color, and fonts for labels, titles, and scales; etc.). Graphics styles are not used to add objects to graphs, but to specify the properties of objects already added to or specified for the graph. Styles can also be used to specify properties of objects that can be added to a graph later (e.g., arrows, rectangles, text, etc.).
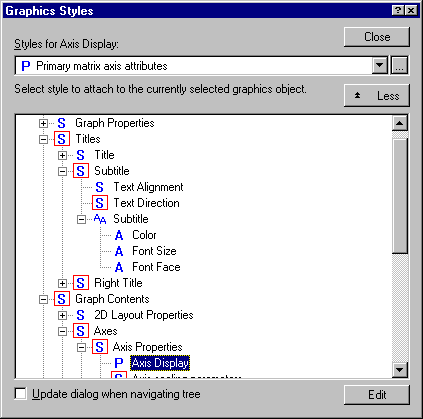
If you are new to graphics styles, at this point you may want to create a graph in STATISTICA (any graph), double-click on the graph background to display the Graph Options dialog box, and then click the Styles button typically located in the lower-left corner. Click the Styles button to display the Graphics Style dialog box for editing the current graphics style (i.e., the style that is the collection of all attributes and properties for the current graph). Then click the More button to display the full Graphic Styles dialog box (and thus expose attributes and properties) as shown in the illustration below.

- Attributes and Properties
- Technically speaking, there are two classes of items for which a style can be created: attributes and properties. In practically all cases, there are no differences between the two in the manner in which you manage (e.g., edit) attributes and properties; however, the distinction can be useful to allow you to keep track of the various aspects of the graph that you may want to customize.
An attribute (designated with an icon
 ) is an object that affects the simple appearance of the graph, such as colors, line patterns, font sizes, font names, etc. Attributes typically have simple values, such as particular colors, line patterns, point patterns, or font sizes. A property (designated with an icon
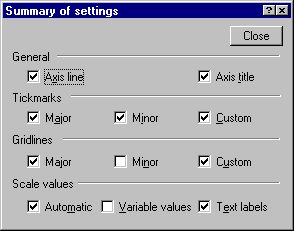
 ) of a graph is an aspect of the graph that usually cannot be represented or summarized by a simple value, such as the Axis Display property. To edit property (see Managing and Editing Graphics Styles), select the Axis Display property and then click the Edit button. A (somewhat) complex dialog box is displayed with various settings that describe this aspect of the graph.
Clearly, the Axis Display property cannot be summarized by assigning to it a single value, and the individual check boxes on this dialog are not associated with separate styles; they can only be saved collectively (as a property).
- Style collections
- There are two additional classes of styles, collections of attributes (
 ) and collections of properties and/or attributes (
 ). All the elements of a collection of attributes are simple attributes,
 . All the elements of a collection of properties and/or attributes are either properties or collections of attributes,
 and
and  . Again, this distinction (and the respective icons used to reinforce this distinction) is not important with respect to how you manage (e.g., edit) these aspect of the style, but is mostly used here to help you keep track of the very large number of aspects of the graphics that can be customized, and managed via styles.
 See also, Managing and Editing Graphics Styles.
