WS Node - Rapid Deployment - Specifications - Lift Chart Tab
In the Rapid Deployment node dialog box, under the Specifications heading, select the Lift Chart tab to access the following options. Select the check boxes for the statistics to be computed and placed in the Reporting Documents after running (updating) the project.
- Category of response
- Select the response category for which to compute the gains and/or lift charts.
- Cumulative lift chart
- Select this check box to show in the chosen lift and gains charts the cumulative percentages, lift values, etc. Clear this check box to show the simple (non-cumulative) values.
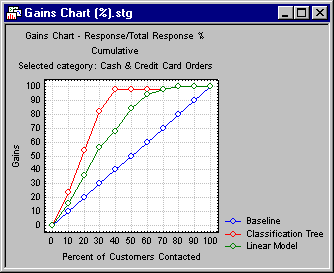
Gains chart. Select this check box to compute a gains chart. This chart shows the percent of observations correctly classified into the respective chosen category (see Category of response) when taking the top x percent of cases from the sorted (by classification probabilities) data file.
Lift chart (response %). Select this check box to compute a lift chart where the vertical (y) axis is scaled in terms of the percent of all cases belonging to the respective category; as in the gains chart, the x axis denotes the respective top x percent of cases from the sorted (by classification probabilities) data file.
Lift chart (lift value). Select this check box to compute a lift chart where the vertical (y) axis is scaled in terms of the lift value, expressed as the multiple of the baseline random selection model.
- Lift table for all types
- Select this check box to generate the gains table for each category of the dependent variable. These tables provide information about the gains and the cumulative gains of the model, and the columns in each table measure the model’r;s performance.
Options. See Common Options.
OK. Click the OK button to accept all the specifications made in the dialog box and to close it. The results are placed in the Reporting Documents node after running (updating) the project.


