Example 5: Setting Up a QC Analysis Configuration
Analysis Configurations require Data Configurations, with the Data Configuration defining the data to be used in the analysis. This example will utilize the Database Connection and Data Configuration defined in the previous examples. The Data Configuration already has the definition of a column to be used as a Variable Characteristic and columns defined as the queried specifications (example, UCL and LCL). This example builds on those configurations to define the Quality Control analyses to use them.
Log on to Enterprise Manager. To begin, right-click on the Data Configuration (Length) set up in the previous example, and select New Analysis Configuration off this Data.
Click the OK button in the prompt to use the same Access Permissions as the Data Configuration, effectively saving the step to define which User/Groups may use and/or edit this object. Then, a warning dialog will be displayed where you can choose to limit the data returned to this week only or return all data. Click the No, return all data button.
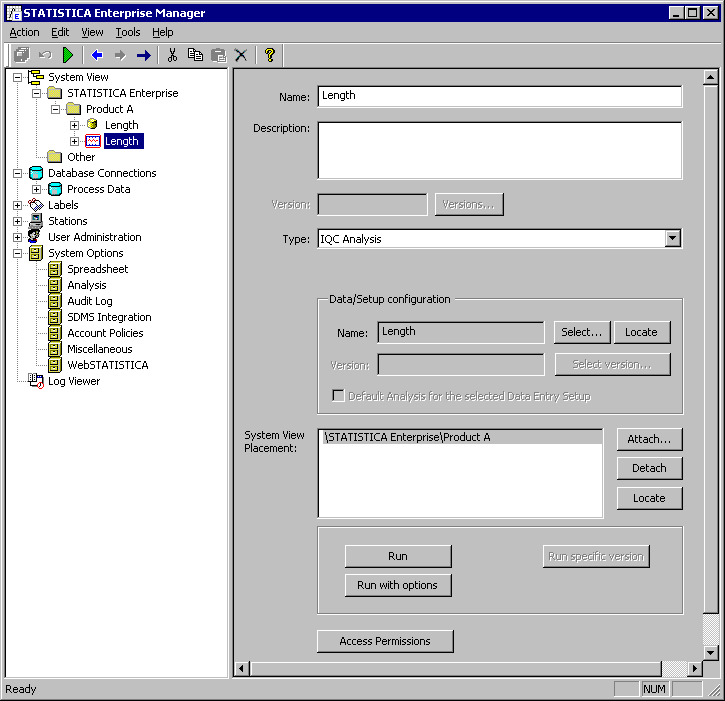
The Analysis Configuration Main View is shown in the properties page of the Enterprise Manager. Provide a name for the Analysis Configuration and select IQC Analysis in the Type drop-down list. IQC Analysis means that Quality Control and Process Capability analyses will be used for this configuration. Note. It is also possible to define Quality Control and Process Analysis analyses using the SVB Analysis type. However, that would require recording or composing a STATISTICA Visual Basic macro rather than defining the options in the graphical user interface of the Enterprise Manager (as shown in this example).
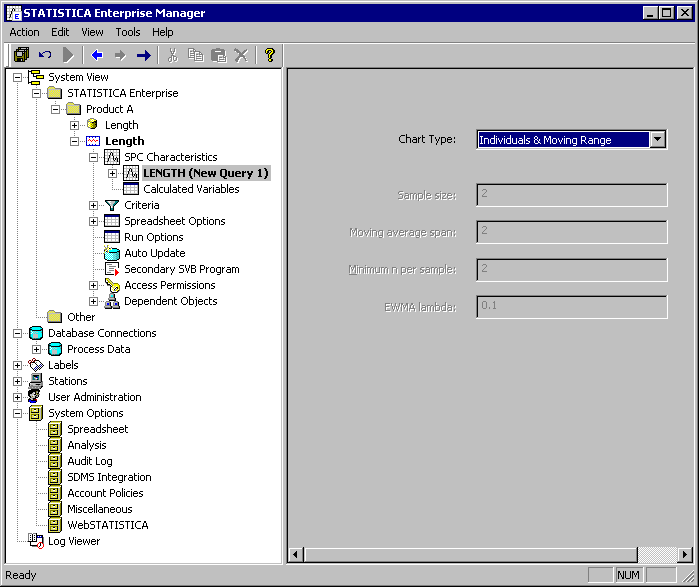
Browse in the tree view to the SPC Characteristics sub-folder of this Analysis Configuration, and expand it. The set of characteristics (from the Target Types assigned to the columns in the Data Configuration) are listed. Select the Length characteristic. In the properties page, set the Chart Type to Individuals and Moving Range. The remaining options will then be disabled because they are irrelevant to that chart type.
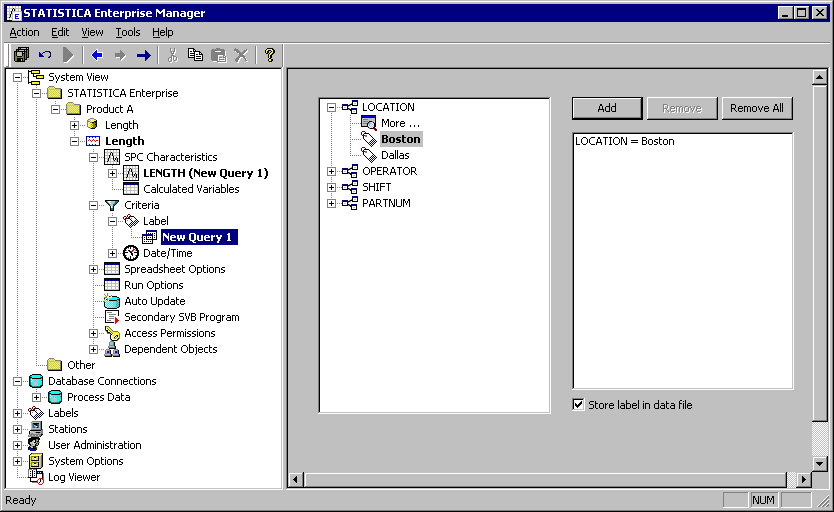
Browse to the Criteria node in this Analysis Configuration. Importantly, each Analysis Configuration allows for additional specific filtering to be stored as part of its configurations. This is important because often it is most efficient to define a very broad Data Configuration to define the querying of data and then perform the specific filtering for the analysis either in the Criteria defined in the Analysis Configuration or by configuring the Analysis Configuration to allow for run-time filtering by the end user; this allows for the fewest number of Data Configurations to be set up and managed to define the data for the largest number of Analysis Configurations. Note that the items listed in the Label subfolder of the Criteria folder are those that were defined as the Target Type - Label in the Data Configuration. As shown below, you can browse the list of values in the LOCATION column. Click the Add button to analyze only the data from Boston.
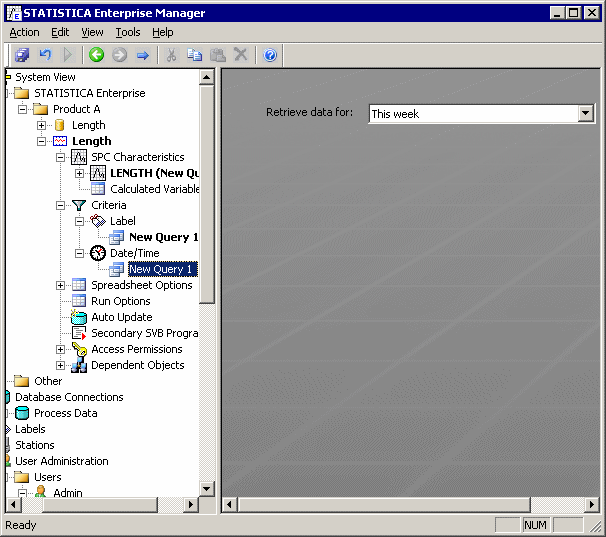
The other node in the Criteria node is Date/Time. When the Data Configuration contains a column set to Target Type - Timestamp, these options will be enabled. The default setting is This week, meaning that based on the current date and time at runtime for this Analysis Configuration, the data queried will be filtered to be only data from the current week. Note. If you do not visit the Date/Time criteria options dialog when setting up an Analysis Configuration, you will get a warning message when saving the configuration to the STATISTICA Enterprise Configurations Database.
Browse to the Spreadsheet Options node in the Analysis Configuration. The data for the analysis is placed into a STATISTICA Spreadsheet. The options here allow control over the formatting of the values in the spreadsheet (e.g., setting the Timestamps to be a particular Date/time display format) and whether the spreadsheet should be locked from editing. Tip. If this Analysis Configuration will be used by users with different regional settings, set the Date/Time format to the Windows one, meaning that it will be the one set in the User's Windows Profile on the server or workstation from which the Analysis Configuration is run.
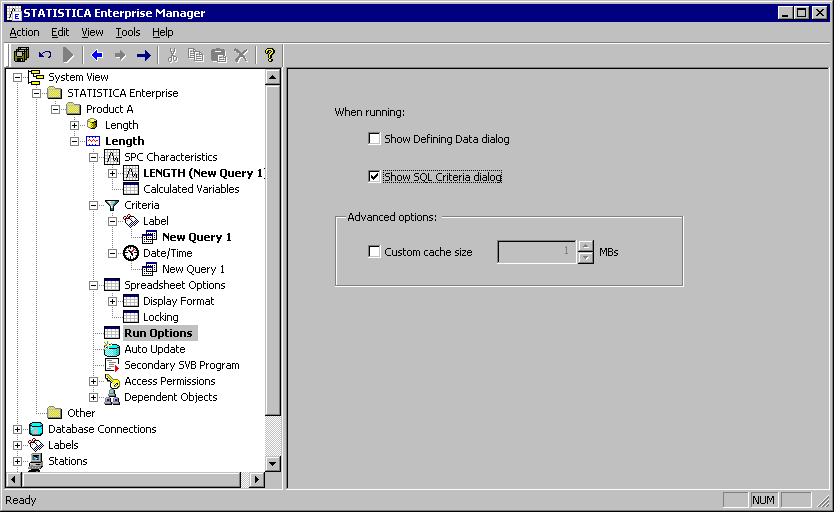
Browse to the Run Options node in the Analysis Configuration. There are two optional filtering dialogs available to be displayed to the end user of this Analysis Configuration at run-time. The SQL Criteria dialog is a common selection for those Analysis Configurations that required filtering by the user at run-time since it supports hierarchical filtering (step-by-step filtering where the options presented in subsequent steps are based on the user's previous selections). Select the Show SQL Criteria dialog check box as shown below.
The last important option to be reviewed in this example is the Auto Update node. If the Data Configuration on which the Analysis Configuration is based has one or more columns set to be an Auto Update column, then the options here will be enabled, allowing for the definition of the frequency by which STATISTICA queries the database for new data.
From the Action menu, select Commit Changes, or press CTRL+S on your keyboard, or click the Commit Changes button on the toolbar to save this Analysis Configuration.
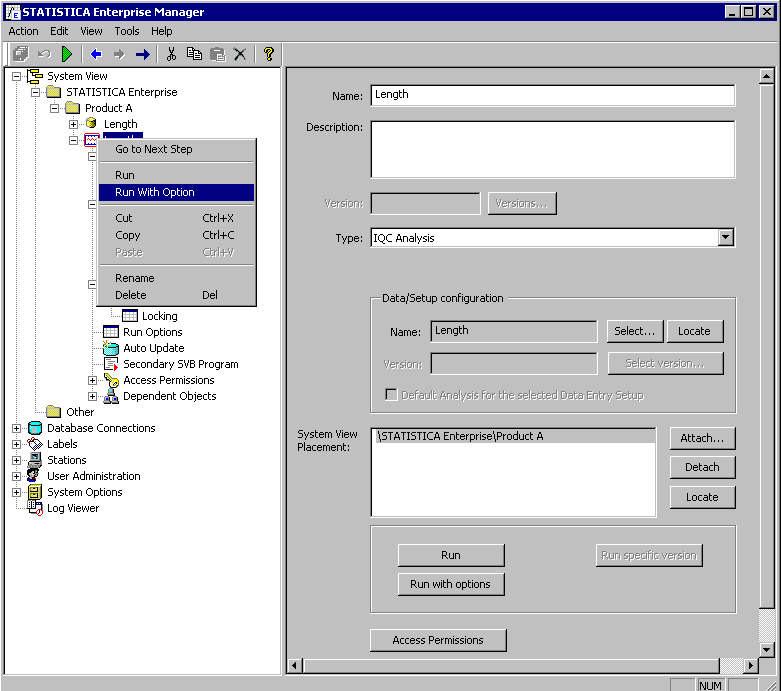
It is common to test the Analysis Configuration at this stage before deploying it for use by end users. Right-click on the Analysis Configuration node and select Run with Option.
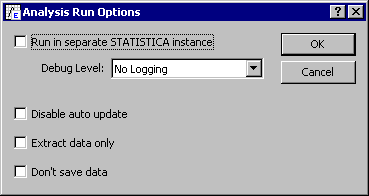
The Analysis Run Options dialog box is displayed.
This dialog box is useful because you can select for a debugging log to be output to C:\SEWSS.log for troubleshooting purposes.


