Example 8: Spectrum (Fourier) Analysis
The Introductory Overview discusses two very simple examples (based on Shumway, 1988) to illustrate the nature of spectrum analysis and the interpretation of results. If you are not familiar with this technique, it is recommended that you first review that section of the Introductory Overview.
Overview and Data File
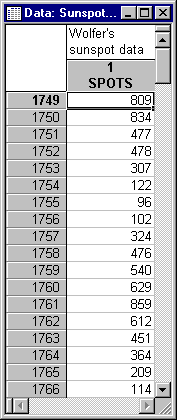
File Sunspot.sta contains part of the famous Wolfer sunspot numbers for the years 1749 through 1924 (Anderson, 1971). Open this data file via the File - Open Examples menu; it is in the Datasets folder. Shown below is a listing of the first few cases in the example file.
The number of sunspots are believed to affect the weather on earth, and thus human activities such as agriculture, telecommunications, etc. In this analysis, you will try to find out whether sunspot activity is cyclical in nature (which it is, this data set is widely discussed in the literature; see, for example, Bloomfield, 1976, or Shumway, 1988).
Specifying the Analysis
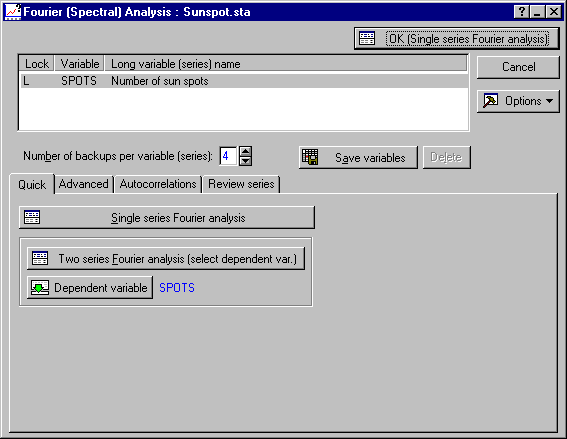
Select Time Series/Forecasting from the Statistics - Advanced Linear/Nonlinear Models menu to display the Time Series Analysis Startup Panel. Note that since the data file Sunspot.sta is currently open and Spots is the only variable in that data file, Spots will automatically be selected in the Time Series Analysis dialog. Now, click the Spectral (Fourier) analysis button to display the Fourier (Spectral) Analysis dialog.
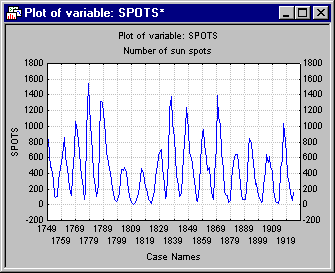
Before performing the spectrum analysis, first plot the sunspot numbers. Note that file Sunspot.sta contains the respective years in the case names. To use those case names in the line plots, click on the Review series tab. Select the Case names option button under Label data points with. Also, select the Scale X axis in plots manually check box and specify Min = 1 and Step = 10. Then, click the Plot button next to the Review highlighted variable button.
The sunspot numbers clearly appear to follow a cyclical pattern. Also, there is no sign of trend; therefore, clear the Detrend check box under Transformation of input series on the Advanced tab.
Obviously, the mean of the series is greater than 0 (zero). Therefore, keep the Subtract mean check box selected [otherwise the periodogram will be "overwhelmed" by a very large spike at frequency 0 (zero)].
You are now ready to begin the analysis. Click the OK (Single series Fourier analysis) button to display the Single Series Fourier (Spectral) Analysis Results dialog.
Reviewing the Results
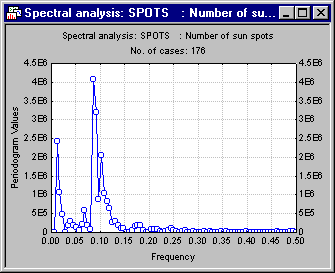
The summary box at the top of the dialog shows some summary statistics for the series. It also shows the five largest periodogram peaks (by frequency). The largest three peaks are at .0852, .0909, and .0114. This information is often useful when analyzing very long series (e.g., with over 100,000 observations) that cannot readily be summarized in a single plot. In this case, however, the periodogram values can easily be reviewed; click the Periodogram button on the Quick tab.
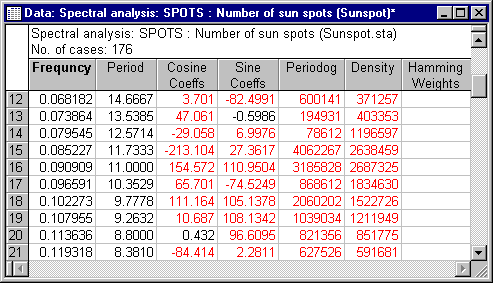
There are two clear "peaks" in the periodogram plot. The largest one is at approximately 0.9. On the Single Series Fourier (Spectral) Analysis Results dialog click the Summary button to see all of the periodogram values (and other results) in a spreadsheet. Shown below is the part of the spreadsheet with the largest peak which was identified in the periodogram.
As discussed in the Introductory Overview, the Frequency is the number of cycles per unit time (where each observation is treated as one unit of time). Thus, the Frequency of 0.0909 corresponds to a Period (the number of units of time necessary to complete one full cycle) of 11. Since the sunspot data in Sunspot.sta represent annual observations, you can conclude that there is a strong 11-year (perhaps a little longer than 11-year) cycle in sunspot activity.
Spectral density
It is customary to smooth the periodogram -- so as to remove random fluctuations -- in order to obtain spectral density estimates. The type of weighted moving average and the window width can be selected in the Data windows for spectral density estimates box on the Single Series Fourier (Spectral) Analysis Results dialog - Advanced tab. The Introductory Overview discusses these options in detail. For this example, accept the default window (5-point Hamming window) and click the Spectral density button on the Review & plot tab.
The two peaks are now even clearer. Look at the periodogram values by period. Click the Period option button under Plot by on the Review & plot tab. Next, click the Spectral density button.
Again, it appears that there is a strong 11-year cycle in the sunspot activity; furthermore, there is some evidence of a longer, approximately 80- to 90-year cycle.
See also, Time Series Analysis Index.

