Example 7: Friedman ANOVA & Kendall Concordance
Friedman's ANOVA by ranks is an alternative to one-way within-subjects (repeated measures) analysis of variance (see the ANOVA and GLM modules). This test compares variables that were measured in dependent samples (repeated measures). Kendall coefficient of concordance essentially denotes the average rank order correlation between the cases. For a discussion of the logic and assumptions of these tests, refer to Nonparametric Statistics Notes - Friedman ANOVA and Kendall Concordance.
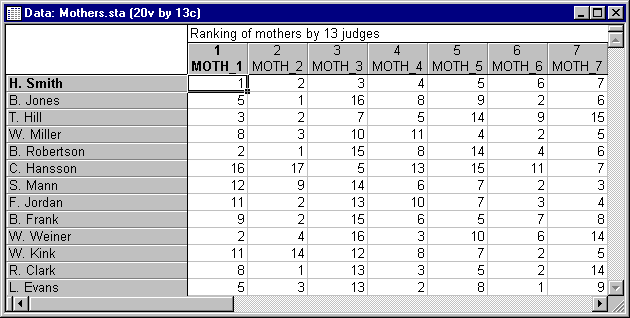
This example is based on a data set reported by Siegel (1956, page 233). Twenty mothers, along with their deaf children, attended a seminar to receive training in how to deal with and care for their children. At the end of the seminar, the 13 staff members ranked the 20 mothers regarding how likely it was that the respective mother would raise her child in a way that would be detrimental to the child's development. The data set is contained in the file Mothers.sta. Open this data file via the File - Open Examples menu; it is in the Datasets folder.
- Purpose of the analysis
- The purpose of this analysis is twofold:
1) To determine whether there are any significant differences among mothers with regard to their ability to raise their children, as judged by the staff members. This question can be answered by the Friedman ANOVA by ranks.
2) Can the judges' opinions be trusted? Put another way, are the judges' ratings in agreement (i.e., correlated)? If not, then you cannot place much faith in the staffs' assessments of the mothers' likely child rearing abilities. This hypothesis (that the judges are in agreement more than what would be expected by chance) will be assessed via Kendall concordance coefficient.
- Specifying the analysis
- Select Nonparametrics from the Statistics menu to display the Nonparametric Statistics Startup Panel. Next, select Comparing multiple dep. samples (variables) from the Quick tab, and then click the OK button to display the Friedman ANOVA by Ranks dialog. Click the Variables button to display the standard variable selection dialog. Here, select all 20 variables (mothers) and then click the OK button.
- Reviewing the results
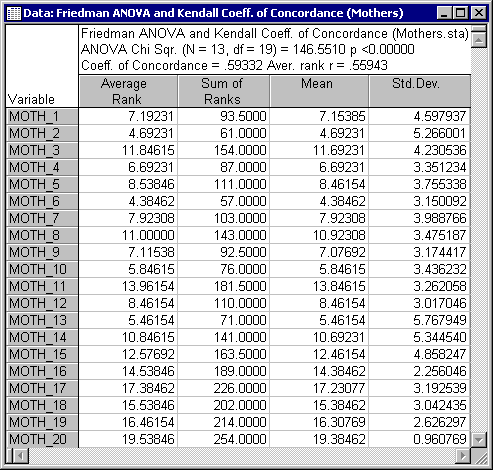
- Now, click the Summary button in this dialog, and a spreadsheet of results will be displayed. As you can see, there are highly significant differences among the mothers. In addition, the staff members show substantial agreement in their judgments - Kendall concordance coefficient is equal to .59 (average rank order correlations is .56; refer to the
Nonparametric Statistics Notes - Friedman ANOVA and Kendall Concordance topic for the precise relationship between these two measures).
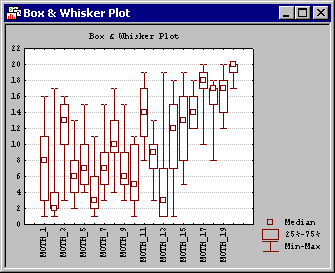
You can produce a box plot to visually display these results by clicking the Box & whisker plot for all variables button on the Friedman ANOVA by Ranks dialog. When you click this button, you will first be prompted to select the statistics for the box plot in the Box-Whisker Type dialog; select the Median/Quart./Range option button and then click the OK button to display the medians, quartile ranges (25th and 75th percentiles), and ranges (minima and maxima) of the variables in the plot.
If you actually knew the names of the mothers participating in the seminar, this graph would give you an indication of who, according to the judgments of the staff, is least likely to be successful in providing her deaf child with the optimum care.
See also, Nonparametric Statistics - Index.


