Example: Creating a Wafer Plot
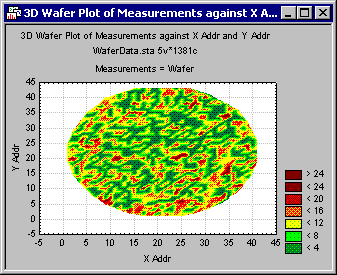
Choosing a Wafer map will cause the data to be rendered as a contour plot using the Wafer fit method. The Wafer fit method displays surface data in a direct format. The collected data are organized in (x,y,z) triples. The (x,y) values specify a grid location, and the z value specifies the value at that grid point. If there are multiple values with the same (x,y) values, then all the corresponding z values are averaged so that there is just one value for every (x,y) pair. The surface is constructed by creating triangles between the individual points and then plotting these triangles with standard surface plot techniques. Only the raw data are used, (i.e., no interpolation or extrapolation is used). The resulting plot can be displayed either in 3D form as a surface or in 2D form as a contour plot.
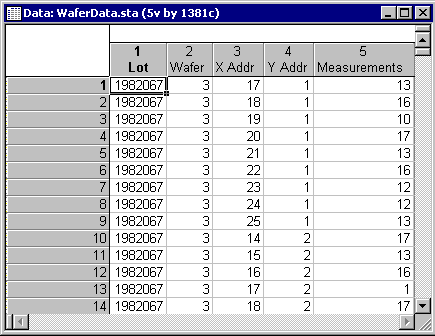
Consider the typical data structure as it is commonly extracted from manufacturing databases, to depict wafer (e.g., defect) data:
- Opening the Data
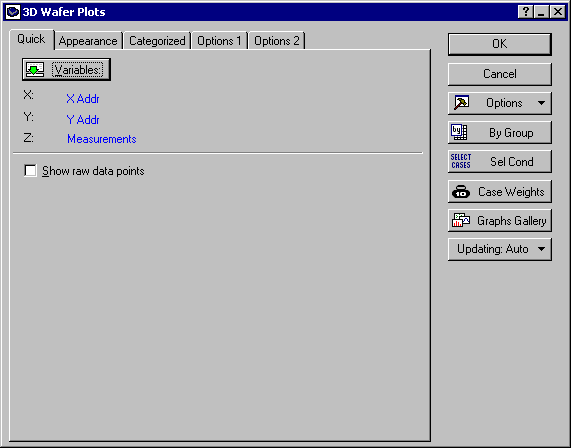
- For this example, select Open Examples from the File menu, double-click on the Datasets folder, and open the data set WaferData.sta. Note that each x-y coordinate is defined in the variables X-Addr and Y-Addr; some measurements of interest (e.g., defects) are recorded into the variable Measurements.
- Creating the Plot
- To create a default wafer plot from these data, select Graphs - 3D XYZ - Wafer Plots to display the 3D Wafer Plots dialog. Click the Variables button to select variable X-Addr and Y-Addr as the X and Y variables, respectively, and select variable Measurements as the Z variable.
Click OK to create the graph.
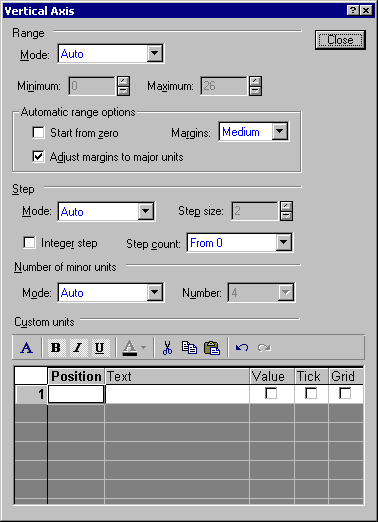
Note: you can adjust the shading (z-scaling) of the graph by double-clicking on the graph to display the Graph Options dialog; select Surface (located under Graph), and then click the Vertical (Z) axis tickmarks, options button to display the Vertical Axis dialog box.Also, you can click the By Group button on the 3D Wafer Plots dialog to produce large numbers of wafer maps by, for example, Lot and Wafer (the example data set only contains data for a single wafer).