Example 5: Crosstabulation Tables
Overview. Even though some tentative conclusions have been reached in the previous examples (Example 3, Example 4), concerning the sports survey, some higher-order tables will now be reviewed. Specifically, the percentage of respondents who are true sports enthusiasts will be determined. That is, the number of respondents who say they are Always interested in watching Football and Baseball and Basketball will be computed. In contrast, the table of Football by Baseball by Skiing will also be computed.
Specifying the analysis. Open the Sports.sta data file and start the Basic Statistics and Tables module.
Ribbon bar. Select the Home tab. In the File group, click the Open arrow and on the menu, select Open Examples. The Open a Statistica Data File dialog box is displayed. Sports.sta is located in the Datasets folder. Then, select the Statistics tab. In the Base group, click Basic Statistics to display the Basic Statistics and Tables dialog box.
Classic menus. From the File menu, select Open Examples to display the Open a Statistica Data File dialog box; Sports.sta is located in the Datasets folder. Next, from the Statistics menu, select Basic Statistics/Tables to display the Basic Statistics and Tables dialog box.
Double-click Tables and banners. In the Crosstabulation Tables dialog box, on the Crosstabulation tab, click the Specify tables (select variables) button to display a variable selection dialog box.
You can select one or more variables in each of the six lists to create multi-way tables. However, for this example, two tables will be specified: Football by Baseball by Basketball and Football by Baseball by Skiing. Therefore, in the variable selection dialog box, select:
Football in List1
Baseball in List2
Basketball and Skiing in List3
Click the OK button. Selecting the variables in this way will create two tables in which the levels of Basketball are used to "slice" one of the tables and of Skiing to "slice" the other table. In other words, each combination of levels of Football and Baseball will be reviewed at each level of Basketball (or Skiing). The Crosstabulation Tables dialog box will appear as follows:
Once you have made your table selections, the Review or delete tables button becomes available. If you click this button to display the Select the tables to be deleted dialog box, you can review the tables that were selected and, if desired, delete specific tables from the list.
Click the OK button to display the Crosstabulation Tables Results dialog box.
This is the same dialog box as in the Stub-and-banner tables example (Example 4), except the Stub-and-banner tables button is not available. On the Options tab select the desired table entries (e.g., Percentages of row counts, Percentages of total count, etc.) and statistics to be computed (e.g., Pearson & M-L Chi-square tests, Spearman rank order correlation, etc.).
On the Advanced tab, when you click either the Summary: Review summary tables button or the Detailed two-way tables button, an intermediate dialog box (Select the tables you want to review) is displayed in which you can select a table from among the previously selected tables. When you select All Tables, spreadsheets are produced for each of the tables listed in this dialog box.
For this example, click the Summary: Review summary tables button. In the Select the tables you want to review dialog box, select the Football Baseball Basketball table (see Example 3 for an example of the Detailed two-way tables button).

Click the OK button.
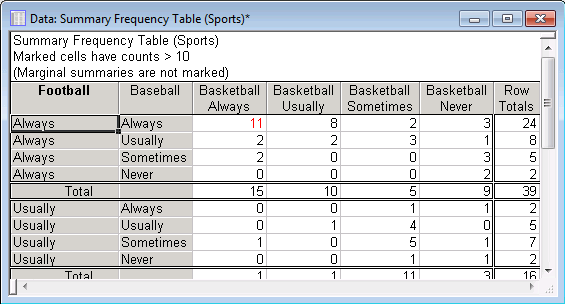
As you can see, 11 respondents from the sample of 100 said that they are Always interested in Football, Baseball, and Basketball.
Return to the Crosstabulation Tables Results dialog box. Click the Summary: Review summary tables button, select the Football Baseball Skiing table, and click OK.
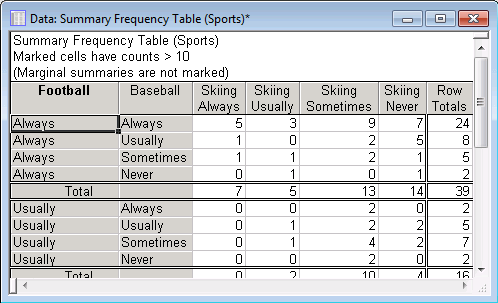
There were only 5 respondents who said that they are Always interested in watching Football, Baseball, and Skiing.
Graphical presentation of crosstabulations. The crosstabulation results can be represented graphically via the Categorized histograms, Interaction plots of frequencies, and 3D histograms buttons in the Results dialog box (on the Advanced tab). As with the other crosstabulation options in the results dialog box, the Select the tables you want to review dialog box is displayed when you select one of the graphic options.
Summary. To summarize this analysis, you can conclude that 11 of the 100 respondents in the sample reported to be always interested in watching football, baseball, and basketball. Thus, it is probably fair to say that about 10% of the clientele in your sports bars are basically devoted general sports fans who watch all major popular sports.
See also, the Basic Statistics and Tables Index and Overviews.