Example 7: Capability Ratios for True Position
The data represent the X and Y coordinates of 30 holes drilled against a true position (0,0) with tolerance diameter = 2.
- Specifying the Analysis
- From the
Statistics - Industrial Statistics & Six Sigma submenu select
Process Analysis to display the Process Analysis Procedures Startup Panel. Select Capability ratios for True Position.
Click the OK button to display the Capability ratios for True Position dialog.
Click the Variables button to display the variable specification dialog.
Select X as the X variable and Y as the Y variable.
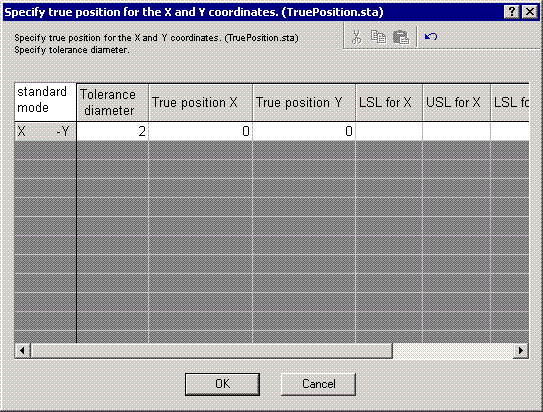
Click OK in the variable selection dialog to close it and return to the Capability ratios for True Position dialog. Click the Process specs button to display the Specify true position for the X and Y coordinates dialog.
Specify 2 as the Tolerance diameter and 0 as the True position X and True position Y values. Click OK in this dialog, and click OK in the Capability ratios for True Position dialog to display the Capability ratios for True Position Results dialog.
- Reviewing the results
- Click the
Capability ratios button to create two spreadsheets (Summary capability for X-Y and
Summary of capability ratios for True Position), as shown in the following illustrations:
The first spreadsheet contains the ubiquitous Cp and Cpk capability ratios along with the univariate statistics for each variable and the LSL and USL values.
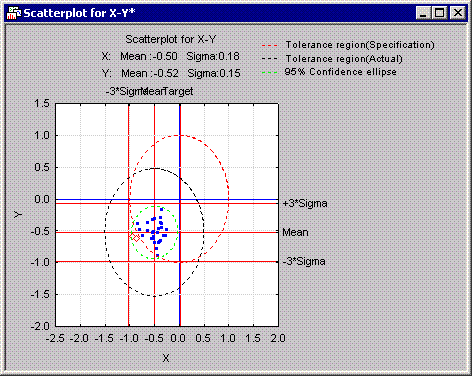
The second spreadsheet contains the capability ratios for true position. The PCp value of 3.6 indicates that the variability in the location of the holes is relatively small compared to the tolerance allowed. The value of PCpk (0.63) indicates that the process is off target.
You can produce a scatterplot of the data by resuming the analysis and clicking the Scatterplot button.


