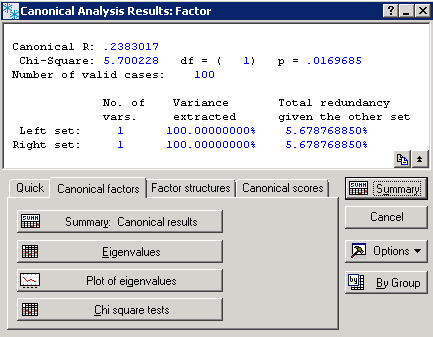
Canonical Factors Tab
Select the Canonical factors tab of the Canonical Analysis Results dialog box to access the options described here.
| Element Name | Element Type | Description |
|---|---|---|
| Summary: Canonical results | Button | Display a spreadsheet with the summary statistics for the current analysis. |
| Eigenvalues | Button | Displays a spreadsheet with the eigenvalues for the canonical roots. Note that the square roots of the eigenvalues are the canonical correlation coefficients. |
| Plot of eigenvalues | Button | Displays a line graph of the eigenvalues. |
| Chi square tests | Button | Displays a spreadsheet reporting, for each canonical root, the canonical R, R-square, Chi-square, degrees of freedom, p-value, and Lambda value. Use the results displayed in this spreadsheet to decide how many canonical roots are statistically significant and should be examined further (that is, interpreted). The so-called sequential significance test works as follows (see also, Introductory Overview). First we look at all canonical roots together, that is, without any roots removed. That test (Chi-square and p-value) is reported in the first row of the spreadsheet. If that test is significant, then we conclude that at least one canonical root is statistically significant. Next we "remove" the first (and most significant) root and test the statistical significance of the remaining roots. That test is reported in the second row of the spreadsheet. |
Copyright © 2021. Cloud Software Group, Inc. All Rights Reserved.

