Features of Analyses
Statistica provides direct access to all statistical and graphical analyses dialogs via the Statistics tab on. the menu.

The Statistics ribbon provides access to all available analysis types within Statistica .
See the Graphs tab on the ribbon:
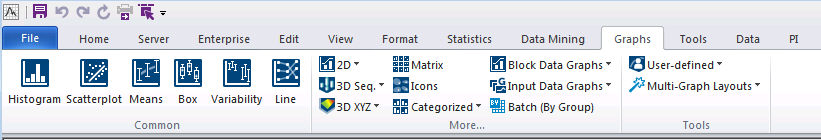
The Graphs menu provides direct access to a variety of commonly used graph types ( scatterplots, histograms, means/error plots, etc.) as well as hierarchical access to all graph types in Statistica , including 2D Graphs, 3D Sequential and XYZ Graphs, Matrix Plots, Icon Plots, Categorized Graphs, User-defined Graphs, Graphs of Block Data, and Graphs of Input Data. It also provides access to Multiple Graph Layouts.
See the Glossary for comprehensive discussions of all various types of statistics and graphs offered by Statistica .
Using the Analysis bar
To take advantage of Statistica's multitasking functionality (see Multiple Analysis Support), Statistica 's analyses are organized as functional units that are represented with buttons on the Analysis bar at the bottom of the application window (above the status bar, see the illustration below, where Descriptive Statistics, Cluster Analysis, and Canonical Analysis are running simultaneously). Normally, at least one analysis button is created, and consecutive buttons are added as you start new analyses.
Minimizing dialogs (and a hint for large screen users)
Depending on your preferences, you can choose to minimize all analysis dialogs when you select another window in Statistica or another application. By default the Auto Minimize command is checked; however, when your screen is large enough to accommodate several windows, it is recommended that you clear this command. This keeps the analysis dialogs on screen while the respective output created from these dialogs is produced, thus allowing you to use the dialogs as toolbars from which output can be selected.
Continuing analyses/graphs
It is easy to continue the current analysis or graph ( to change the focus to the current dialog for a particular analysis). Select Resume from the Tools - Analysis Bar menu, press CTRL+R, or click the analysis/graph button on the Analysis bar. When multiple analyses are running, you can select the specific analysis from the Tools - Analysis Bar - Select Analysis/Graph menu (as shown below).

Hiding windows
To further facilitate the organization of windows from various analyses, you can hide all windows associated with a particular analysis when that analysis is deselected by checking Hide on Select from the Tools - Analysis Bar - Options menu. By default, this command is cleared. Note that this command only applies when the results are sent to individual windows; see Five Channels for Output from Analyses for more details on managing output from analyses. In addition, there is a command to close all document windows, Window - Close All (or CTRL+L), and a command to close all analyses, Tools - Analysis Bar - Close All Analyses.
Bringing windows to the top
Check Bring to Top on Select from the Tools - Analysis Bar - Options menu to activate (bring to the top of Statistica a) all windows associated with a particular analysis when that analysis is selected, replacing whatever dialogs were on top. This command also facilitates the organization of individual windows from various analyses. By default, this command is checked. Note that this command only applies when the results are sent to individual windows.
Hiding the summary box
By default, a summary box is located at the top of certain results dialogs (such as Multiple Regression - Results) and contains basic summary information about the analysis. You can hide an individual summary box by clicking the
![]() button in the lower-right corner of the summary box. You can also suppress the display of all summary boxes globally by checking
Hide Summary Box on the
Tools - Analysis Bar - Options menu.
button in the lower-right corner of the summary box. You can also suppress the display of all summary boxes globally by checking
Hide Summary Box on the
Tools - Analysis Bar - Options menu.