How do I define categories in categorized graphs?
If categorized graphs are requested from output dialogs of specific procedures that involve analyses of subsets of data, then they will automatically display the subsets that are currently analyzed (i.e., the subsets are already defined as part of the current analysis). On the other hand, the categorized graphs requested from the Graphs menu offer a variety of methods to specify subsets using one or two grouping variables. Also, custom-defined subset definitions can be used that can involve all variables in the current datafile.
Specifically, categories can be defined by:
• Integer values of grouping variables (Integer Mode),
• Dividing grouping variables into a requested number of equal-length intervals (Categories),
• Custom intervals (ranges) of grouping variables, defined by specific interval boundaries (Boundaries),
• Specific values (i.e., codes) of grouping variables (Codes), and
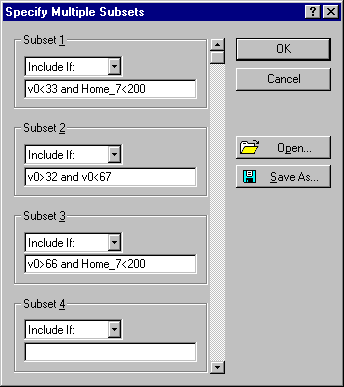
• User-defined "multiple-subset" definitions (Multiple Subsets) that can be entered as logical case selection conditions of virtually unlimited complexity (this categorization method can involve values of all variables in the current datafile (see Methods of Categorization).
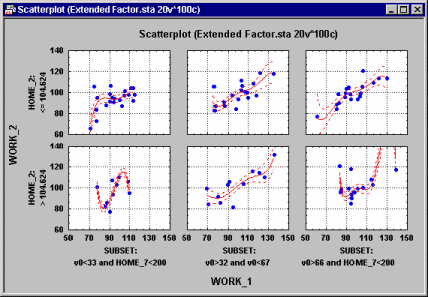
The graph shown above is a relatively complex example of a two-way categorized graph based on a mixed method of defining the subset (component) graphs. The two-way categorization means that the arrangement of the small (component) graphs in the display resembles a two-way table (crosstabulation) resulting from applying two different criteria of categorization.
For example, in the graph shown above, the two rows of graphs represent categories defined based on values of variable Home_2 (cases where Home_2 is less than or equal to 104.624 and cases where it is greater than 104.624). The three columns of graphs represent subsets of cases defined using specific "multiple subset" definitions based on values of variable number 0 (i.e., case numbers) and variable Home_7. The following is the 2D Categorized Scatterplots dialog where the above graph was defined (select Scatterplots from the Graphs - Categorized Graphs menu).
Specifically, variable Work_1 and Work_2 are plotted in each small graph (as variables X and Y, respectively). The first of the two categorizations (X Categories, or "columns" of graphs) was defined as Multiple Subsets in a dialog that is displayed after the Specify Subsets button is clicked.


