Example 4: Regression Models
This example uses the data file Heart.sta; see the Survival Analysis Examples - Overview and Data File topic for a description of this data file. The data file Heart.sta contains some additional variables: the age of the patient at the time of the transplant (variable Age), a measure of antigen mismatch (variable Antigen), and a tissue mismatch score (variable Mismatch).
It is of interest to determine the relationship between variables Age, Antigen, and Mismatch, and survival times. The most general regression model (that does not make any assumptions about the nature or shape of the underlying survival function) is Cox's proportional hazard model. You can estimate the regression coefficient for these three independent variables in the prediction of survival times using the proportional hazard model.
Specifying the Analysis
Open the Heart.sta data file by selecting Open Examples from the File menu (classic menus) or by selecting Open Examples from the Open menu on the Home tab (ribbon bar); it is in the Datasets folder.
- Select Survival Analysis from the Statistics - Advanced Linear/Nonlinear Models menu to display the Survival and Failure Time Analysis Startup Panel.
- Double-click Regression models to display the Regression Models for Censored Data dialog box.
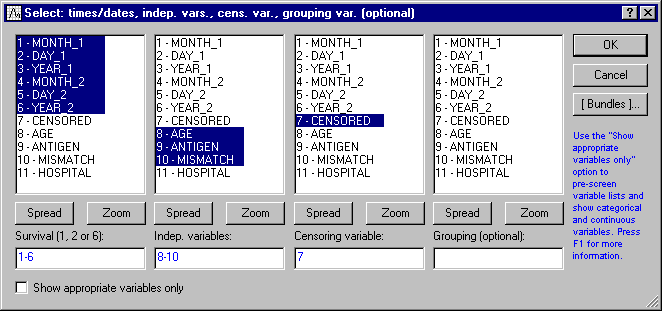
- To select the variables for the analysis, click the Variables (survival times, indep., censoring, (optional) grouping) button to display the standard variable selection dialog box. Here, select the first 6 variables as the Survival (1, 2 or 6). Statistica interprets the first and fourth variable in the list as months, the second and fifth as days, and the third and sixth as years. Next, specify the variables Age, Antigen, and Mismatch as the Indep. variables, and variable Censored as the Censoring var.
- Click OK to return to the Regression Models for Censored Data dialog box (if the Variables contain text values/text labels dialog box is displayed, click the Continue with current selection button).
- Double-click the Code for complete responses field to display the Variable 7 dialog box. Select Complete and click OK.
- In the same manner, double-click the Code for censored responses field and select Censored. The Regression Methods for Censored Data dialog box is displayed.
Estimating the Parameters
Reviewing the Results
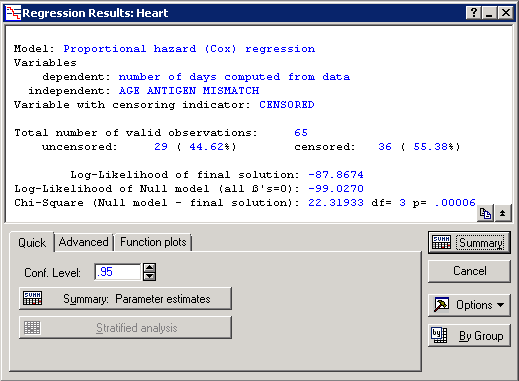
This dialog box gives the overall Chi-square value for the model; because the Chi-square shown above is highly significant, you can conclude that at least some of the independent variables are significantly related to survival. Click the Summary: Parameter estimates button to review the parameter estimates and their standard errors.
The Standard Errors are computed as part of the estimation procedure, and they are asymptotic in nature. Specifically, they are computed from the second-order partial derivatives of the log-likelihood function. This means that the t-values should also be considered to be approximations.
Usually, any parameter estimates that is at least two times larger than its standard error (t>2.0) can be considered to be statistically significant (at the p<.05 level); the spreadsheet also reports the Wald Statistic for each coefficient (see Rao, 1973; this test is based upon the asymptotic normality of maximum likelihood estimates; see the Technical Notes). Therefore, you can conclude from the spreadsheet above that age and tissue mismatch are the most important (significant) predictors of hazard.
Plots
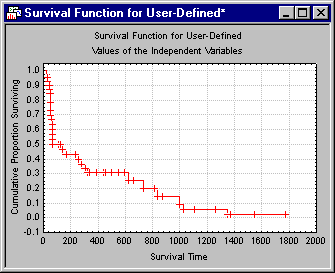
In addition to the parameter estimates, you can review graphs of survival as a function of the independent variables, that is, conditional on certain values of the independent variable.
- When all independent variables are at their mean (click the Graph survival function for means button on the Function plots tab); or
- When the covariates have user-specified values (click the Graph survival function for spec. vals. button on the Function plots tab to display the Independent Variable Values dialog in which you enter the values to use in the plot and then click the OK button).


