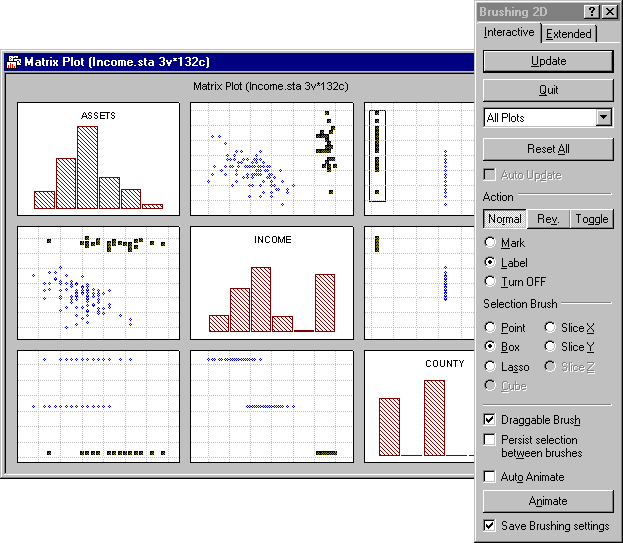
How can brushing be used in exploratory data analysis?
There are countless applications of brushing to explore relationships between variables and/or the contribution of specific data points or subsets to those relationships.
A "typical" illustration of the use of brushing in exploratory data analysis is the examination of the contribution of data points representing different ranges or different levels of one variable to correlations between other variables, which can be inspected visually using a scatterplot matrix. For example, by including a categorical, three-level variable such as income level (Income) in a scatterplot matrix, then by using the Box, Lasso, or Slice X brush, points can be selected from one income level, and the location of these points in scatterplots of all other variables (e.g., Assets, Debt) becomes immediately apparent.

