TMPCA Example
This example is based on a case study by P. Nomikos and J. MacGregor (1995, February; see references for more details).
- Data file
- The data come from an industrial batch polymerization reactor. The batch duration is approximately two hours, divided into 100 equally spaced time intervals each. At any time interval, 10 process variables were measured:
- Var1, Var2, and Var3: temperature measurements inside the reactor
- Var6 and Var7: temperature measurements in the heating-cooling medium
- Var4, Var8, and Var9: pressure measurements
- Var5 and Var10: Flow rates of material added to the reactor during the batch operation
Thus, for a single batch, there were 100 readouts of 10 measurements (process) variables, which makes a single batch consisting of 100 cases in total.
The original data set consisted of 55 batches, 47 of which belonged to successful batch runs (i.e., acceptable polymer quality). The rest were either bad batches or batches with qualities near the borderline of tolerance.
Good batches: 1-37, 39, 41, 43, 44, 47, and 48
Borderline quality batches: 38, 45, 46, and 49
Unsuccessful batches: 40, 42 and 50-55
In this example, the data described above is in two files: NormalBatches.sta and BatchesForDeployment.sta. The former contains the first successful 30 (B1-B2) batches. The latter has 25 batches of mixed quality (see the above categorization). These data files are located in the /Examples/Datasets directory of STATISTICA.
The data set contains the following columns:
Column 1: Batch identifier variable
Column 2-11: Process variables (see above for more details).
Column: 12: Time identifier variable.
- Objectives
- Our objective is to 1) apply TMPCA to the NormalBatches.sta data file to construct a reference model for the evolution of good batches, and 2) use this model to identify future successful or unsuccessful batches using the data set BatchesForDeployment.sta, which contains both successful and unsuccessful batches.
Ribbon bar. Select the Home tab. In the File group, click the Open arrow, and on the menu select Open Examples to display the Open a STATISTICA Data File dialog box. the NormalBatches.sta data file is located in the Datasets folder.
Next, select the Statistics tab. In the Advanced/Multivariate group, click PLS, PCA to display the Multivariate Statistical Process Control Startup Panel.
Classic menus. On the File menu, select Open Examples to display the Open a STATISTICA Data File dialog box; the data file is in the Datasets folder.
Then, on the Statistics menu, select PLS, PCA, Multivariate/Batch SPC to display the Multivariate Statistical Process Control Startup Panel.
On the Quick tab, select Time-wise multi-way principal component analysis (TMPCA).
Click the OK button to display the TMPCA dialog box.
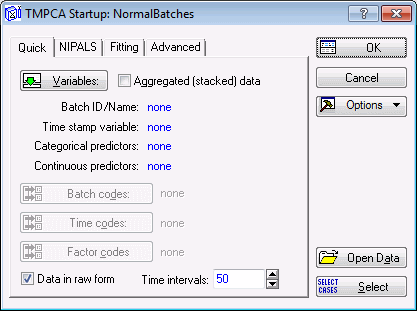
On the Quick tab, click the Variables button to display a standard variable selection dialog box.
Select variable v1 - Batch Num as the Batch identifier variable to associate cases of the measurement variables with a particular batch.
Select v12 - TIME0 as the Time variable. This will further identify cases of the measurement variables with a particular time slot. Thus, by selecting a batch and a time variable, we can uniquely associate the measurements of the process variables to a particular time slot within a batch.
Select v2-v11 (Var1-Var10) as the Continuous process variables.
Although there are no categorical variables in this particular data set, STATISTICA TMPCA can support the use of such variables should your data set contain one or more. For each categorical variable, a dummy set is created using a 1-of-N coding scheme. Each new variable is then treated as the rest of the continuous variables. For example, a categorical variable with three categories (A, B, C) is represented by three dummy variables that can only take values 0 or 1. Thus:
A: (1, 0, 0)
B: (0, 1, 0)
C: (0, 0, 1)
The variables you selected from the previous step defines a 3-dimensional matrix. Using the direction of time, STATISTICA TMPCA unfolds this into a two-dimensional matrix that can then be subjected to a normal Principal Component Analysis (PCA).
In the variable selection dialog box, click the OK button to accept the variable selections, close the dialog box, and return to the TMPCA Startup dialog box.
Below the Batch codes, Time codes, and Factor codes buttons are options for Extract, Transform, and Load (ETL). When the Data in raw form check box is selected, MSPC will use ETL functionality to convert "raw" datetime values (e.g., 3/17/2009 5:32 PM) into discrete time interval steps (e.g., 1, 2, 3). Since the data set in this example already has datetime values expressed as discrete time interval steps, clear the Data in raw form check box.
At this point you may want to check the analysis configuration, which is determined by the option settings on the Quick, NIPALS, Fitting, and Advanced tabs. These tabs provide various control settings that can be adjusted to suit your individual analysis.
For example, on the NIPALS tab, you can increase the Maximum number of iterations the NIPALS algorithm will be allowed to take for extracting a single component of the PC model. You can also increase the accuracy required for calculating the principal components by lowering the value of the Convergence criteria.
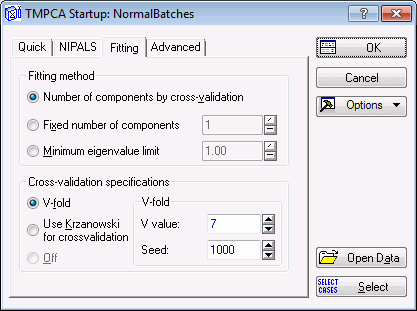
On the Fitting tab, you can select the method for determining the number of components in the PC model. The number of principal components determines how complex your model will be. The more principal components a model has, the better it can fit the training data, at the expense of a less favorable performance on validation sets (i.e., poor generalization error). Thus, it is important that you select the number of components in your PC model with care. You can either let the cross-validation method determine this factor for you, or use the Fixed number of components option to set model complexity manually. Other options for determining model complexity include extracting all components with eigenvalues larger than a specified limit.
Although the seed for the cross-validation random number generator is determined by the time on your computer, for this example set the Seed value to 1000. This will ensure that you will be producing the same results shown in the spreadsheet and graphs of this step-by-step example.
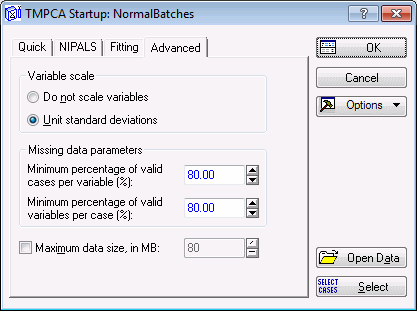
An important feature of STATISTICA TMPCA is its preprocessing functionality, which enables you to scale data for better model building. The default is Unit standard deviations (this option is located on the Advanced tab). It is generally recommended that you scale your variables to unit variance (for more details on variable scaling, see PCA and PLS Technical Details).
The settings discussed above will determine not only the results, but also the quality of your model, i.e., its ability to predict unseen examples and detect important features that might be present in the data, such as outliers. In the context of batch processing, outliers can be an indication of abnormal batches. Detecting such batches is one of the primary goals of process monitoring in quality control. Note that each analysis is unique, and care should be taken in configuring its settings.
Next, click the OK button in the TMPCA dialog box. This will initiate the NIPALS algorithm and, when complete, the TMPCA Results dialog box will be displayed.
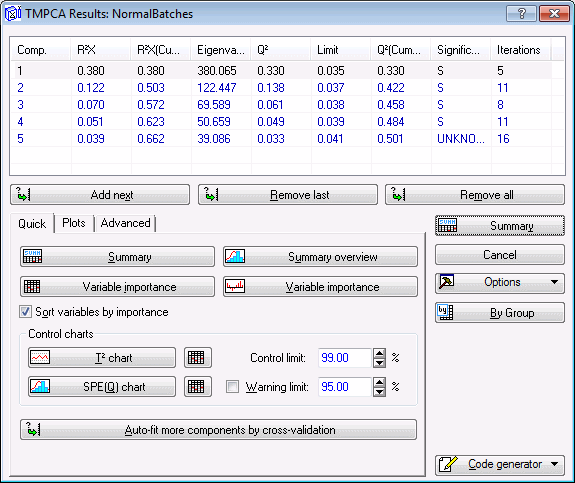
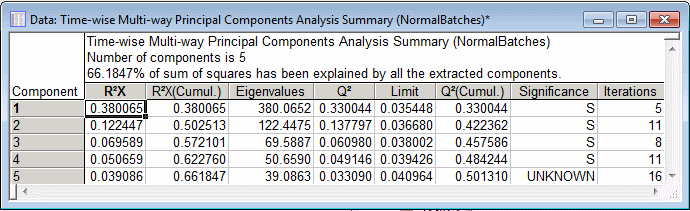
The Summary box, located at the top of the Results dialog box, contains information about the model such as R2X, eigenvalues, Q2, significance, and the number of Iterations for each component. This information can also be displayed in spreadsheet format by clicking the Summary button on the Quick tab.
You can also generate histogram plots of the cumulative R2X and Q2 by clicking the Summary overview button on the Quick tab.
A study of the graph shows that cumulative R2X improves, i.e., tends to become unity, as more and more components are added to the model.
Note: you can use the Interactive Graphics Controls at the bottom of the graph window to adjust the plot areas transparency and to scroll and pan in order to interactively scale the graph. Also, in the Graph Options dialog box - Graph: Layout tab, you can adjust the plot areas gradient or turn the gradient off.In this particular example, we used the cross-validation method for determining the optimal number of principal components (i.e., model complexity), which happens to be 5 in this case. This means that, on this occasion, the cross-validation algorithm found a PC model with 5 components to best represent the data set.
The variable importance is a useful quantity in PCA. It measures how well a variable is represented by the principal components. This is often known as power, a quantity ranging from 0 to 1. For a mature model (a model with a sufficient number of components), variables that are not well represented (have low values of power) are more likely to be insignificant.
To view the variables in descending order, on the TMPCA Results dialog box - Quick tab, verify that the Sort variables by importance check box is selected, and then click the Variable importance button with the spreadsheet icon:
to generate a variable importance spreadsheet.
Also, you can review the modeling power of the variables in histogram format by clicking the Variable importance button with the graph icon.
You can manually add and remove components from the PC model using the Add next, Remove last, and Remove all buttons in the Results dialog box. This feature can be used to monitor changes in the importance of a variable with the increase in the number of principal components.
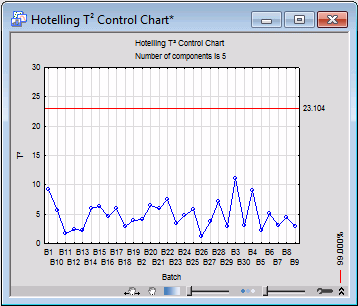
One important chart to review is the so-called Hotelling T2, which you can use to detect moderate (by comparison) outliers (i.e., abnormal batches). Produce this chart by clicking the T2 chart button on the Results dialog box - Quick tab.
For this analysis, all batches lay well below the limits of tolerance, which should come as no surprise since the data set contains successful batches only.
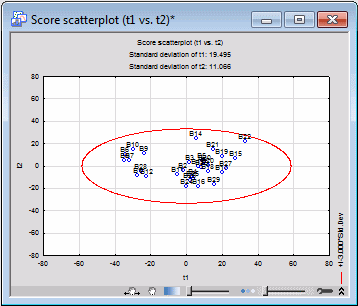
Further batch diagnostics can be carried out using the scatterplot of the t-scores. The t-scores are the transformed values of the process variables in the principal component system. A t-score with too high a value (i.e., one that deviates substantially from the point of origin) can be regarded as a sign of abnormality.
To generate a t-scores scatterplot, first select the Plots tab. In the First component list, select Component 1, and in the Second component list, select Component 2. Select the Display text labels check box (to display variable names in the scatterplot).
Next, click the Scatter (t) button to create a scatterplot of the t-scores for PC1 against the t-scores of PC2.
Again, we note that all the 30 batches are within the limit defined by the outer ellipse, which once more indicates normality.
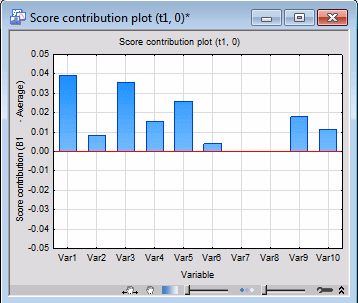
Another useful graph you can produce is the variable contributions to the scores of a principal component for a specific batch and time slot. Click the Contribution button with the graph icon:
For the default settings (i.e., first batch and time slot), we note that Var1, Var3, and Var5 make most of the contributions, while Var2, Var6, Var7, and Var8 appear to be almost insignificant.
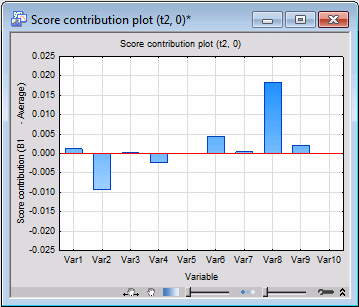
The above graph can be compared with the same for the second principal component. Select Component 2 in the First list, and click the Contribution button with the graph icon.
We see that most of the variables with the exception of Var2 and Var8 seem to be insignificant. In contrast to Var8, Var2 makes a negative contribution.
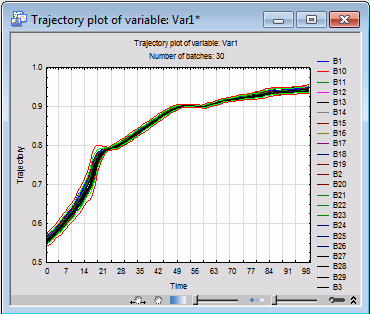
Finally, we can further analyze our batch model by examining the trajectory of its process variables. On the Advanced tab, select Var1 from the Trajectory drop-down menu, and click the Trajectory button with the graph icon:
The Select batch codes dialog box will be displayed. Select all the batch codes, and click OK to create a trajectory graph of Var1 plotted against time for the selected batch codes.
Again, we can see that none of the batches exhibit any noticeable abnormality.
Having created and analyzed the TMPCA model for the evolution of normal batches, you can now save your work for future reference (i.e., for monitoring whether future batches are normal or abnormal). With STATISTICA, you can save your models in PMML (Predictive Markup Model Language) format.
To save a model, click the Code generator button in the lower-right corner of the Results dialog box, and select PMML script from the drop-down menu. This will create code for the current TMPCA model and place the file in a STATISTICA Workbook.
To save the file, right-click on the Report icon (Time-wise Multi-way Principal Components Analysis PMML deployment code) in the tree pane of the STATISTICA Workbook. Select Save Item(s) As… from the shortcut menu to display the Save As dialog box and save the PMML code in an XML file.
In the File name field, enter TMPCANormalBatches. In the Save as type drop-down list, ensure that XML Files as text (*.xml)is selected, and click the Save button.
Deployment of TMPCA Models.
Having created and saved the TMPCA model, you are now ready to analyze new batches, i.e., batches that are not part of the data set used to create the TMPCA model.
Close all the currently opened dialog boxes, workbooks, and spreadsheets.
Open the data set BatchesForDeployment.sta, which contains batches (31-55) that were excluded from building the TMPCA model.
Then, display the Multivariate Statistical Process Control Startup Panel.
Select MSPC Deployment on the Quick tab, and click OK to display the Deployment Model dialog box, where you can load existing model files saved in PMML format for analyzing new batches.
Click the Load models button on the Deployment Model dialog box - Quick tab. The Open PMML files dialog box will be displayed. Browse to the location where the TMPCANormalBatches.xml file was saved, select it, and click the Open button.
- TMPCANormalBatches.xml.
- This file contains PMML code for the TMPCA model created in the first part of this example. Now you are ready to analyze the data set. Note that you can load multiple models of the same type. However, you can execute only one model at a time (i.e., only the active model). You can specify the active model from the Model drop-down menu on the
Results tab.
To start with, you may want to look at the summary of the loaded model. Click the Model summary button on the Results tab.
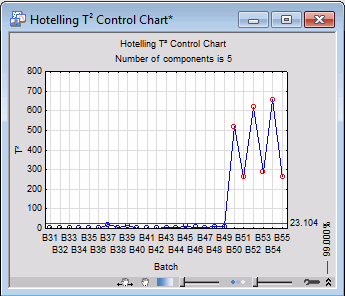
The next step is to check whether there are abnormal batches in the data set. Click the T2 Chart button to produce a T2 chart.
Notice that batches 50-55 are very different from the rest. They possess significantly larger values of T2, which is a clear indication of deviation from normality.
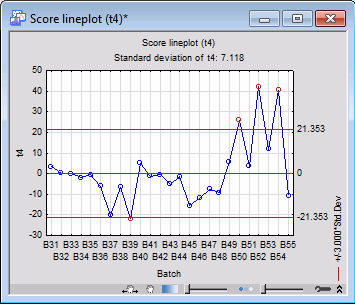
Next, generate the t-score lineplots for the first four principal components.
On the Results tab, select component 1 from the Component drop-down menu, and then click the Score (t) button. This will generate a t-score lineplot for the first principal component. Repeat the same for components 2, 3, and 4.
Reviewing the t-score charts, we can see clear signs of abnormality (high t-score values) from the first graph in the direction of the first principal component for batches B50 and B52.
For the second plot, we also see signs of abnormality for B50, B52-B55. B51 is close to the border of abnormality.
The third and fourth lineplots lead to similar conclusions. Thus, we can conclude that batches B50-B55 are out of control.
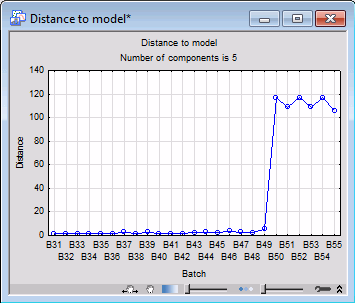
Next, click the D-To-Model button to generate a distance-to-model line plot for the batches in the data set. Again, we see that values of distance-to-model for B50 through B55 are unusually high, which suggests that they are very different from the normal batches, which have substantially smaller values of distance-to-model.
Often the reason behind the abnormal progress of a batch is the unusual trend in the evolution of the process variables. Thus, by examining the time trajectory of these variables, you can decide which variable contributed to the evolution of the abnormal batch. If a process variable was substantially different in trend compared to its trend in normal batches, this could be used as evidence that this variable has contributed to the abnormal evolution of the batch. Such analyses can be carried out by examining variable contributions and trajectory plots.
Select batch B50 from the Batch drop-down menu and click the Contribution button to generate a histogram of the variable contributions for the selected batch. A comparison of this graph with those belonging to normal batches shows that the contribution of Var4 (pressure measurements) is significantly lower.
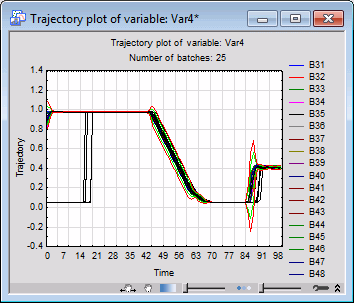
The above finding can be confirmed further by plotting the trajectory of Var4. Do this by selecting Var4 from the Trajectory drop-down menu and clicking the Trajectory button. When the Select Batch Codes dialog box is displayed, select all batch codes.
Again we see that around the time interval 0-20 the trend in the evolution of the process variable in question for batch B50 is substantially lower as compared to the normal batches. Thus, you can conclude that Var4 is one of the variables that have contributed to the abnormal evolution of B50. Of course you can continue this line of analysis for all the process variables and determine which ones were further responsible for this abnormality.
For more details on deployment, see the PCA Deployment example.