GC&RT Results - Observational Tab
Select the Observational tab of the GC&RT Results dialog box to access options for reviewing plots and spreadsheets of observed and predicted values for each observation. Many of the options available here pertaining to predicted and residual values are only applicable to, and hence only available for regression-type problems (for continuous dependent variables).
| Element Name | Description |
|---|---|
| Sample | Select the respective option button in the Sample group box to specify on which type of sample to compute the predicted and residual statistics. If these options are not available, no valid cases were found in the respective type of sample. |
| Analysis | Select this option button to display and plot predicted and residual values for all observations that were used to compute the current results. |
| Test set | Select this option button to display and plot all observations that were not used to compute the current results, but have valid data for all predictor and dependent variables. |
| Prediction | Select this option button to display and plot all cases that have valid data for the predictor variables, but missing data for the dependent variable. |
| Surrogate | Select this option button to display and plot only those cases with missing data for at least one predictor variable used for splitting, if those cases were included in the analyses by using surrogate splits (see, for example, the description of the Number of surrogates option on the Quick specs dialog box - Advanced tab). However, note that while predictions can be made for observations with missing data (in the predictors, and a suitable surrogate), these observations are not included in the tree-building process itself. See also, Missing Data in GC&RT, GCHAID, and Interactive Trees for additional details. |
| Predicted values | Click this button to produce a spreadsheet that shows the observed and predicted values for the current tree. If the response variable is categorical, the results also indicate the terminal node for each case and the observed classifications, predicted classifications, and posterior prediction probabilities for each response category. If the response variable is continuous, the spreadsheet contains the terminal node ID for each case, and predicted values and their standard errors for each observation. Note that plots of predicted and residual values only apply to (are available for) analyses involving a continuous dependent variable. |
| Save predicted values | Click this button to display a variable selection dialog box to select variable(s) to be displayed together with the predicted values in a data file for further analysis. After you select the variable(s), a spreadsheet containing the specified variable(s) along with the predicted values is produced. |
| Predicted vs. residuals. | Click this button to produce a scatterplot of the predicted values and the corresponding residuals for the dependent variable. Note that this plot is only available for regression-type analyses (with a continuous dependent variable). |
| Observed vs. predicted. | Click this button to produce a scatterplot of the observed and the predicted values; this plot is only available for regression-type analyses (with a continuous dependent variable). |
| Observed vs. residuals | Click this button to produce a scatterplot of the observed values and the corresponding residuals for the continuous dependent variable; this plot is only available for regression-type analyses (with a continuous dependent variable). |
| Probability plot of residuals | Click this button to produce a normal probability plot of residuals for the continuous dependent variable; this plot is only available for regression-type analyses (with a continuous dependent variable). |
| Histogram of Residuals | Click this button to produce a histogram of residuals; this plot is only available for regression-type analyses (with a continuous dependent variable). |
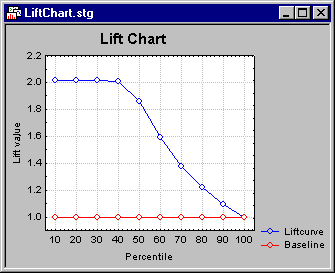
| Lift chart | This option is only applicable (available) for classification-type analyses (with a categorical dependent variable), when the categorical dependent variable is binary in nature, i.e., only contains two discrete values. The lift chart provides a visual summary of the usefulness of the information provided by a statistical model for predicting a binomial (categorical) outcome variable (dependent variable). Specifically, the chart summarizes the gain that you can expect by using the respective predictive model compared to using baseline information only.
For details regarding the interpretation of lift charts, see the Glossary entry by the same name. Refer also to the Rapid Deployment of Models module documentation for methods to produce overlaid (comparative) lift and gains charts for multiple predictive models and multinomial responses (with more than two categories). |
Copyright © 2021. Cloud Software Group, Inc. All Rights Reserved.

