Example 3: Interrupted ARIMA
This example is based on data presented in McDowall, McCleary, Meidinger, and Hay (1980), who provide an excellent applications-oriented introduction to interrupted time series analysis (see also the Introductory Overview for a discussion).
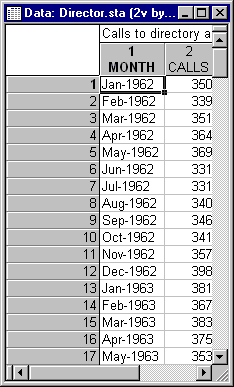
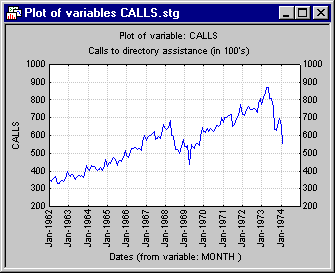
The data in the example file Director.sta will be used. This file contains the number of monthly calls (in 100's) to Cincinnati Directory Assistance over the period from January, 1962, through December, 1976. In March 1974 (the 147'th month in the series), Cincinnati Bell initiated a new 20 cent charge for calls to Directory Assistance. This caused a marked drop-off in the number of requests for assistance, and the purpose of this analysis is to fit a model to the series that takes this abrupt change into account. Open this data file via the File - Open Examples menu. Shown below is a listing of the first few cases in the data file Director.sta.
Model Identification
As in Example 1, the first step is to identify an appropriate model for the series. In this case, a regular ARIMA model will first be fit to the observations prior to the introduction of the service charge; then, an intervention component will be added to analyze the complete series.
To start the analysis, select Time Series/Forecasting from the Statistics - Advanced Linear/Nonlinear Models menu to display the Time Series Analysis Startup Panel. There are 146 months of observations in the series prior to the introduction of the service charge. To open only those observations into the active work area, click the Select Cases button (below the Options button on the Startup Panel) and specify the condition Include cases v0<147.
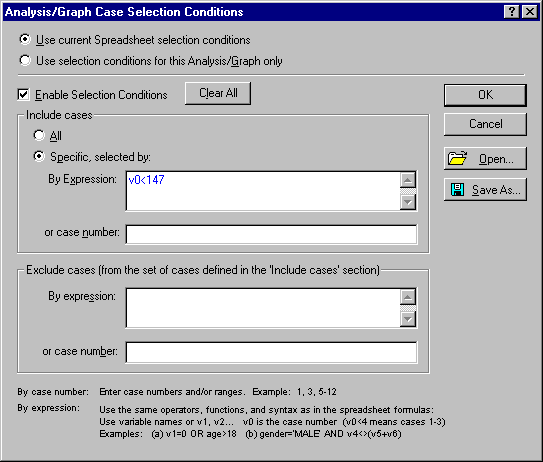
V0 in the selection condition shown above refers to the case numbers, so only cases numbers less than 147 will be included in the analysis. Now click the OK button, then click the Variables button to display the standard variable selection dialog. Here, select the variable Calls and click the OK button. Then click the ARIMA & autocorrelation functions button to display the Single Series ARIMA specification dialog.
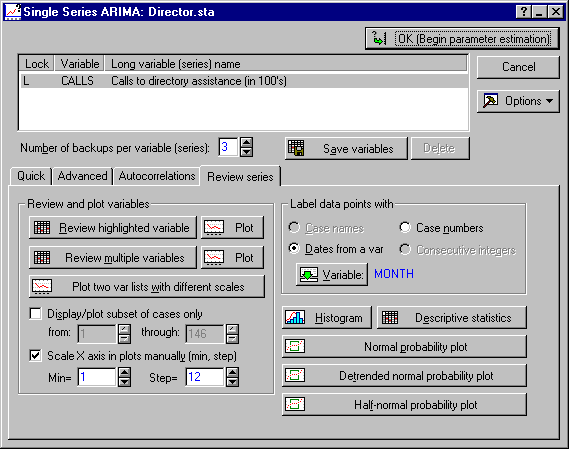
First plot the series; file Director.sta contains a variable with dates that can be used to label the horizontal x-axis of line plots. Click on the Review series tab, then select the Dates from a var option button to display a standard variable selection dialog. Here, select variable Month as the date variable and click the OK button. Since each year consists of 12 observations, also select the Scale X axis in plots manually check box and enter 12 in the Step box.
Now click the Plot button next to the Review highlighted variable button.
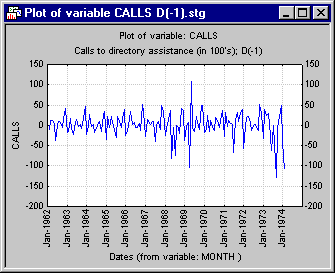
The series shows a linear upward trend, so some differencing will probably be necessary. Click on the Advanced tab, and then click the Other transformations & plots button to display the Transformations of Variables dialog. To perform simple (non-seasonal) differencing, click on the Difference, integrate tab and select the Differencing (x=x-x(lag)) option button. Be sure that the lag parameter is set to 1, and then click the OK (Transform selected series) button. After all cases have been transformed, the differenced series will be plotted (unless you previously cleared the Plot variable (series) after each transformation check box on the Review & plot tab).
Autocorrelation
As described in the previous example and the Introductory Overview, the autocorrelation and partial autocorrelation functions are the most important tools for identifying an appropriate ARIMA model. Because the series consists of monthly observations, you may suspect that any seasonality will occur with a seasonal lag of 12. If seasonal differencing is necessary you would expect substantial autocorrelations at multiples of the seasonal lag (by contrast, a stationary series would be characterized by an autocorrelation function that dies out, the longer the lag); therefore, on the Autocorrs tab, set the Number of lags parameter under Autocorrelations & crosscorrelations to 25 so that you may detect such a pattern. Then click the Autocorrelations button.

Indeed, the autocorrelation function shows no sign of decaying but suggests that further (seasonal) differencing is necessary. Bring up the Difference, integrate tab again and perform Differencing (x=x-x(lag)) with lag=12. Shown below are the autocorrelation and partial autocorrelation functions for the resulting series. (Click the Autocorrelations and Partial autocorrelations buttons on the Autocorrs tab.)
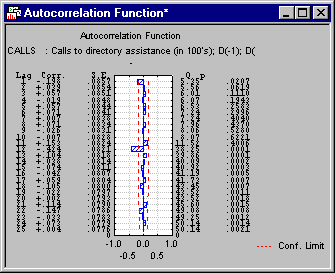

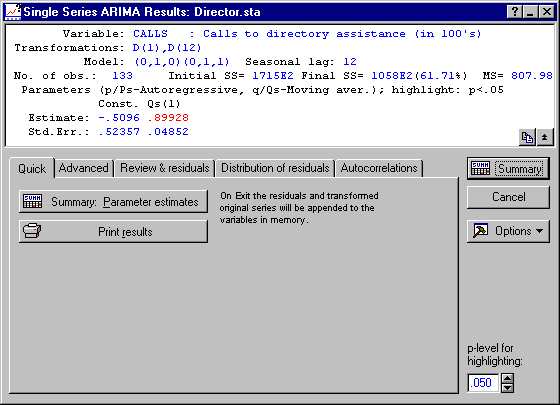
Both plots show a small spike at lag 1 and another stronger spike at 12. The two spikes show no sign of gradual decay in the autocorrelation function, and so McDowall et al. (1980, page 69) suggest a moving-average process rather than an autoregressive process. Specifically, they initially fit a model to the first 146 observations of the series that includes non-seasonal and seasonal differencing, one seasonal autoregressive parameter, and a constant.
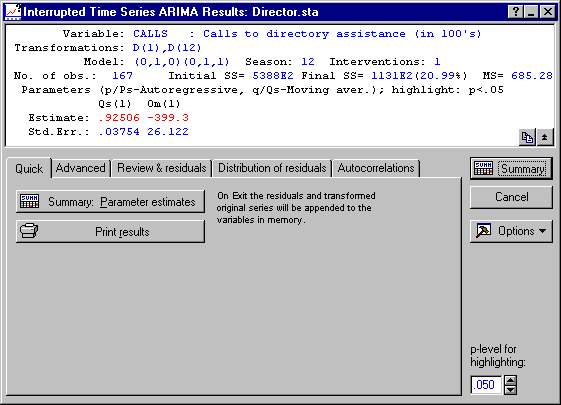
In standard terminology (see Introductory Overview), the model (0, 1, 0) (0, 1, 1) will be fit with seasonal lag 12 and a constant.
Specifying the ARIMA Model
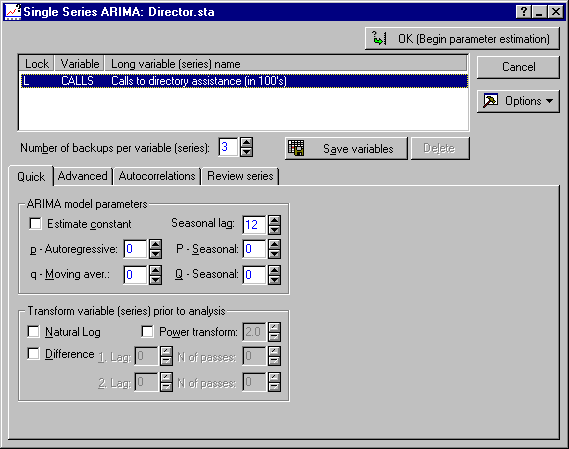
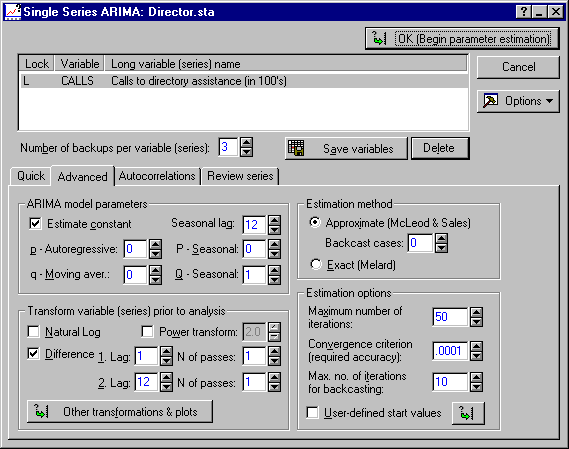
Now return to the Single Series ARIMA dialog (click the Cancel button on the Transformations of Variables dialog). Delete the differenced series from the active work area (by selecting each differenced series and clicking the Delete button), and select (highlight) the original untransformed series Calls. Next, specify 1Seasonal moving average parameter (Q) and a Seasonal lag of 12, and select the Estimate constant check box on the Advanced tab. Then, select the Difference check box under Transform variable (series) prior to analysis and specify differencing with 1. Lag: 1 (1 N. of passes) and 2. Lag: 12 (1 N. of passes). Make sure that the Approximate (McLeod & Sales) option button is selected under Estimation method.
You are now ready to proceed; click the OK (Begin parameter estimation) button. After the parameter estimation finishes, the Single Series ARIMA Results dialog is displayed.
Preliminary Results
Click the Summary: Parameter estimates button to display a spreadsheet with the parameter estimates.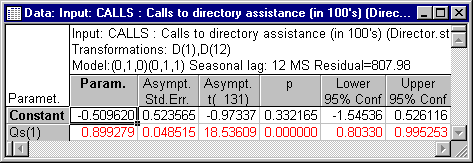
The constant is not statistically significant; therefore, McDowall et al. (1980) suggest to drop it from further analyses. Now, quickly look at the Autocorrelations and Partial autocorrelations of residuals on the Autocorrelations tab.
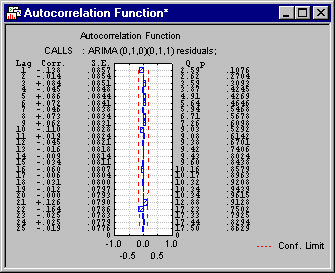
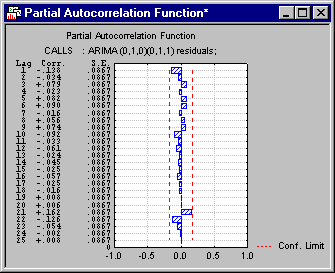
There is no evidence of any significant residual serial dependency in the data. Therefore, you can be satisfied that you have identified a reasonable model for the series.
Specifying Interrupted ARIMA
Now, exit the Single Series ARIMA Results dialog by clicking the Cancel button to specify an ARIMA model for the entire series, accounting for the introduction of the 20 cents user-fee for calls to Directory Assistance. Now, click the Cancel button on Single Series ARIMA dialog to return to the Time Series Analysis Startup Panel and click the Select Cases button. Note that, after exiting from the Single Series ARIMA Results dialog, the differenced series as well as the ARIMA residuals were automatically appended to the active work area. When you change the selection conditions, the active work area will be cleared, and a respective message box will appear to warn you that this is about to happen; when you subsequently select another type of time series analysis, the selected original variables will be read again, using the new selection conditions. Simply click Yes in response to the warning, and then turn off the case selection conditions (click the Clear All button and then the OK button). Next click the Interrupted time series analysis button to display the Interrupted Time Series ARIMA dialog.
As you can see, all prior specifications are still in place. However, before proceeding, look at the entire series, that is, including the observations following the introduction of the service charge. Click the Other transformations & plots button on the Advanced tab and then plot the series (use the Plot button beside the Review highlighted variable button on the Review & plot tab as before).
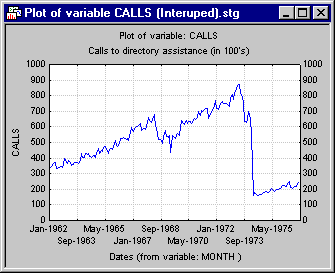
Evidently, the service charge caused a sharp abrupt decline in the number of calls to Directory Assistance. Now click the Cancel button to exit the Transformations of Variables dialog and go back to the Interrupted Time Series ARIMA dialog.
Specifying the intervention
The Time Series module allows you to model three types of interventions: Abrupt-Permanent, Gradual- Permanent, and Abrupt-Temporary. The Introductory Overview discusses these types of interventions in detail. In this case, looking back at the plot of the entire series, it certainly looks like the introduction of the service charge caused an abrupt and permanent change in the number of calls to Directory Assistance. However, in other cases the result of an intervention may not be as apparent; McDowall et al., (1980, pages 83-85) discuss how one might proceed when the researcher has no a priori hypotheses concerning the nature of the impact. Now, specify the intervention. Select the 1 check box in the Specify times and types of interventions group on the Advanced tab. The service charge was introduced at the 147'th month in the series; thus specify 147 in the At case number field. Finally, remember that you (and McDowall et al.) concluded that a constant is not necessary for these data (i.e., after differencing); therefore clear the Estimate constant check box.

You are now ready to proceed with the parameter estimation. Click the OK (Begin parameter estimation) button, and when the parameter estimation is done, the Interrupted Time Series ARIMA Results dialog is displayed.
Reviewing the Final Results
Click the Summary: Parameters estimates button to display a spreadsheet with the final parameter estimates.
The seasonal moving average parameter is highly significant. Parameter Omega(1) is the intervention parameter, and it is also highly significant. For Abrupt, Permanent interventions, Omega can simply be interpreted as the amount of permanent change that occurred at the point of intervention. Thus, you may conclude that the introduction of the 20 cents service charge for Directory Assistance reduced the number of such calls by about 399 * 100 = 39,000 calls.
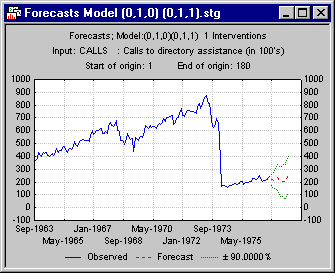
Forecasts
Residual analysis
Before concluding the analysis, perform some final model checks. Shown below are the autocorrelation and partial autocorrelation functions for the residuals. (Click the Autocorrelations and Partial autocorrelations buttons on the Autocorrelations tab.)
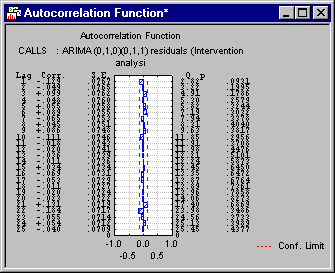
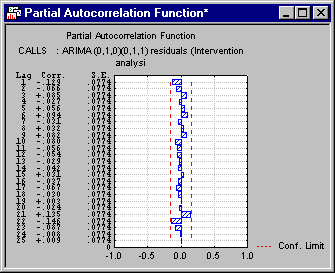
There is no evidence of any residual serial dependency in the data. Click the Histogram button on the Distribution of residuals tab to review the distribution of residuals.
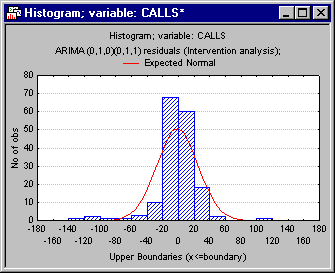
Even though the distribution of the residuals seems leptokurtic (i.e., more "peaked" than the standard normal distribution), they approximate the normal distribution reasonably well. Now click the Cancel button to return to the Interrupted Time Series ARIMA dialog again; the ARIMA residuals as well as the differenced series and the ARIMA forecasts will be appended to the active work area. As in Example 1, look at a final summary graph that includes the original series as well as the residuals. Click the Other transformations & plots button on the Advanced tab, and then select the Plot two var lists with different scales button on the Review & plot tab. In the Select variables for plot/spreadsheet dialog, select to plot the original series Calls and the ARIMA residuals.

Now, click the OK button to produce the plot.

It looks like the fit of the ARIMA model is as good or better following the intervention as it is prior to the intervention. In other words, there is no evidence that after the intervention the ARIMA residuals show some kind of non-random (white noise) pattern. If that were the case, one might suspect that the ARIMA model you identified from the series prior to the intervention (i.e., based on the first 146 observations only) does not fit the series after the intervention; however, in your case there is no evidence of this.
See also, Time Series Analysis Index.