Auto-Updating Graphs and Summary Statistics after Each Drill-Down
You can set up the Interactive Drill-Down Explorer so that results are automatically updated after each drill-down operation. In the Startup Panel, select the Auto-update all results check box, or on the Options tab, select the Create stand-alone results spreadsheets check box, which will have the same effect (the two options are "linked" and selecting one will automatically select the other). From this point on, all results spreadsheets (except the input spreadsheet created via the Save current raw data option on the Quick tab) and graphs will automatically be created in stand-alone windows (and not, for example, in the workbook), and updated after each drill-down or drill-up operation.
- Example
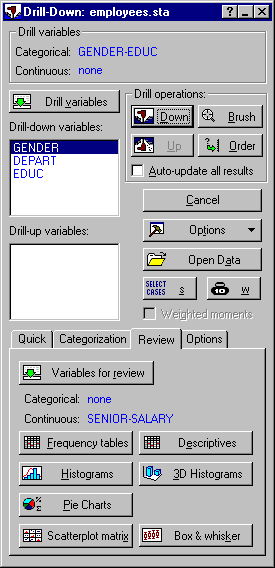
- Open the example data file Employees.sta; this file contains some (fictitious) employee files for Sooner Pretzel Company. Display the Interactive Drill-Down Explorer Startup Panel, click the Drill variables button, and select variables Gender, Depart, and Educ as the categorical drill-down variables. Next, on the Review tab, click the Variables for review button, and select variables Senior (seniority) and Salary.
Next, select the Auto-update all results check box in the Startup Panel, or click the Options tab and select the Create stand-alone results spreadsheets check box (which has the same effect, i.e., these two options are "linked" and selecting one will automatically select the other). Go back to the Review tab and click the Scatterplot matrix button and the Histograms button (note that if many histograms are being produced, you can delete those that are not of interest to you; only the ones remaining on the screen will be auto-updated).
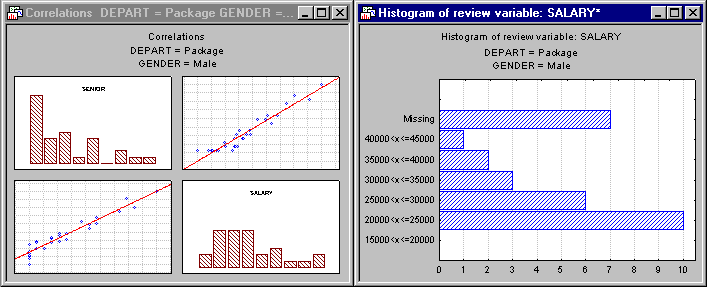
Now perform the drill-down (-up) operations as usual. Any time that the drill-down state changes (i.e., after each drill-down and drill-up operation), the histograms and the scatterplot matrix displayed on the screen will be updated to reflect only those cases selected by the current drill-down state.
For example, shown below are selected graphical summaries for the packaging department and for male employees only.
By interactively drilling down/up while reviewing graphical summaries in stand-alone windows that are automatically updated, it is very easy to detect differences between different groups (combinations of categories) with respect to variables selected and displayed for review.


