Macro (SVB) Programs Example - Creating User-Defined Custom Functions
- User-defined custom functions
- Via Statistica Visual Basic, a user-defined fit can be created and used for 2D and 3D XYZ graphs. This functionality can be used for both fits and custom functions. It is enabled when using event macros and is useful for creating highly domain-specific types of graphs (e.g., special types of wafer plots used in the semiconductor industry).
- Example program
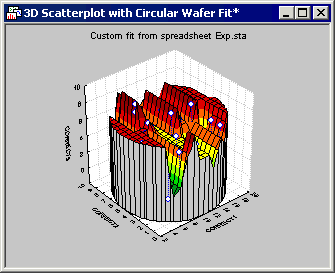
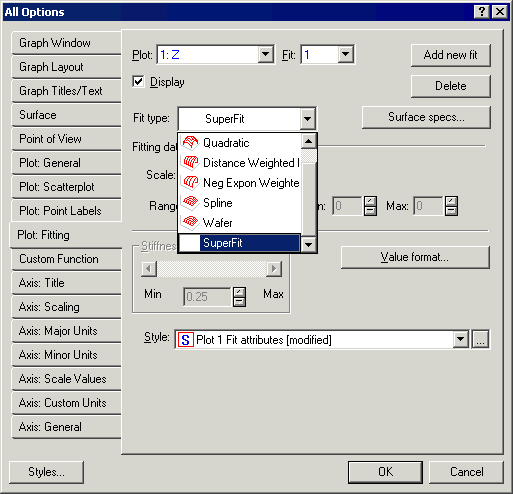
- This program illustrates how to create a user-defined custom function. When the macro is run, a 3D scatterplot is created using variables from the active data set, and then a user-defined fit (SuperFit) is applied to the data. As long as the macro continues to run, this “SuperFit” will be available on the Plot: Fitting tab of the Graph Options dialog box.
Option Base 1
Option Explicit
Dim WithEvents Newgraph As Graph
Sub Main
'Create a graph object naming it "3D Scatterplot with Circular Wafer Fit"
Set Newgraph = Graphs.New("3D Scatterplot with Circular Wafer Fit")
'Create the graph content, in this case 3D scatterplot
Dim Newlayout As Layout3DScatterplot
Set Newlayout = Newgraph.GraphObject.CreateContent(scg3DScatterplot)
'This statement retrieves the number of cases
'in the current "active for input" data Spreadsheet.
Dim NCases As Long
NCases = ActiveDataSet.NumberOfCases
'Add a plot to the graph
Dim Newplot As Plot3DScatterplot
Set Newplot = Newlayout.Plots.Add(NCases)
'This section enables the user To select the variables from the active data set
'First, declare the arrays of Integer's or Long's, to hold the variable lists;
'Note that they are declared here without an Explicit dimension yet.
Dim VarList1 () As Long
Dim VarList2 () As Long
Dim VarList3 () As Long
Dim Nvars As Long
'The InList1, 2, and 3 will hold the number of variables that were selected.
Dim InList1 As Long
Dim InList2 As Long
Dim InList3 As Long
Dim ret As Integer
'This statement retrieves the number of variables
'in the current "active for input" data Spreadsheet.
Nvars = ActiveDataSet.NumberOfVariables
If Nvars<1 Then GoTo Finish
'Next the array of Long values VarList1, 2, and 3 are re-dimensioned;
'We will allow up To the total number of Variables In the Input Spreadsheet
'To be selected into the VarLists.
ReDim VarList1(1 To Nvars)
ReDim VarList2(1 To Nvars)
ReDim VarList3(1 To Nvars)
'Note that SelectVariables functions return 1 if the user exited by pressing OK;
'They return 0 if the user exited by pressing Cancel.
ret = SelectVariables3 (ActiveDataSet, _
"Variables for Analysis", _
1, Nvars, VarList1, InList1, "X-axis variable", _
1, Nvars, VarList2, InList2, "Y-axis variable", _
1, Nvars, VarList3, InList3, "Z-axis variable")
Dim xVar As Integer, yVar As Integer, zVar As Integer
xVar = VarList1(1)
yVar = VarList2(1)
zVar = VarList3(1)
If ret=0 Then GoTo Finish
Dim i As Integer
For i = 1 To NCases
Newplot.Variable(1).Value(i) = ActiveDataSet.Value(i, xVar)
Newplot.Variable(2).Value(i) = ActiveDataSet.Value(i, yVar)
Newplot.Variable(3).Value(i) = ActiveDataSet.Value(i, zVar)
Next
Finish:
'Add a fit to the plot
Dim Newfit As Fit3D
Set Newfit = Newplot.Fits.Add()
'Set the fit type to user defined. This is what tells the graph to call our custom fit event.
Newfit.FitType = scgFitUserDefined
'This property allows you to make the graph round.
Newlayout.Circular = True
'Here you can control the number of grid lines displayed on the fit
Dim s As Surface
Set s = Newfit.Surface
s.DisplayLinesX = 50
s.DisplayLinesY = 50
'Add titles
Newgraph.Titles.Add(scgMainTitle, "Custom fit from spreadsheet " + ActiveDataSet.Name)
Newlayout.Axes.XAxis.Title.Text = ActiveDataSet.VariableName(xVar)
Newlayout.Axes.YAxis.Title.Text = ActiveDataSet.VariableName(yVar)
Newlayout.Axes.ZAxis.Title.Text = ActiveDataSet.VariableName(zVar)
'Make the graph visible
Newgraph.Visible = True
'Since the macro needs to continue running for it to be able to respond to events,
'we create an infinite Loop
Do
DoEvents
Loop
End Sub
Private Sub Newgraph_OnCalculateFit3D(ByVal Mode As StatisticaGraphics.UserFitMode, ByVal PlotID As Long, ByVal FitID As Long, ByVal xStart As Double, ByVal xStep As Double, ByVal xCut As Long, ByVal yStart As Double, ByVal yStep As Double, ByVal yCut As Long, ByVal dataCount As Long, xValues() As Double, yValues() As Double, zValues() As Double, status As Long, FitValues() As Double, FitName As String)
'Mode will either equal UserFitModeTest or UserFitModeCalculate.
'In Test Mode it Is going To retrieve the Name of the Fit As well As a status value.
'A status value of 2 tells the event that when it fires in UserFitModeCalculate mode,
'it will return the Graph data In the arrays xValues(), yValues(), And zValues().
'You could use those arrays to base your calculations based on the data in the graph.
'If you don't need the data you can set the status = 1 which will
'generate less overhead when firing the event.
If Mode = UserFitModeTest Then
FitName = "SuperFit"
'status set to 1 tells the event to not include the raw data
'when the Event Is fired In UserFitModeCalculate Mode.
'If the status is set to 2 it will include the raw data.
status = 2
Else 'UserFitModeCalculate
'This is where the Fit data is returned to the graph.
'FitValues() Is a one dimensional Array that should be Set To the Size xCut * yCut.
Const MISSING_VAL = -999999998
ReDim FitValues(1 To (xCut * yCut))
Dim i As Integer
'Initialize FitValues elements to MISSING_VAL
For i = LBound(FitValues) To UBound(FitValues)
FitValues(i) = MISSING_VAL
Next
'Find the min and max values for the X and Y coordinates used in the graph
Dim dMinX As Double, dMaxX As Double
Dim dMinY As Double, dMaxY As Double
dMinX = dMaxX = xValues(LBound(xValues))
For i = LBound(xValues) + 1 To UBound(xValues)
If xValues(i) > dMaxX Then dMaxX = xValues(i)
If xValues(i) < dMinX Then dMinX = xValues(i)
Next
dMinY = dMaxY = yValues(LBound(yValues))
For i = LBound(yValues) + 1 To UBound(yValues)
If yValues(i) > dMaxY Then dMaxY = yValues(i)
If yValues(i) < dMinY Then dMinY = yValues(i)
Next
'Get the ratio for number of cuts compared to x and y coordinate range
Dim ratioX As Double
ratioX = xCut/(dMaxX - dMinX)
Dim ratioY As Double
ratioY = yCut/(dMaxY - dMinY)
For i = LBound(xValues) To UBound(xValues)
Dim x As Double
Dim Y As Double
Dim z As Double
x = xValues(i)
Y = yValues(i)
z = zValues(i)
Dim xElement As Integer
Dim yElement As Integer
Dim element As Integer
xElement = (xValues(i) - dMinX) * ratioX
yElement = (yValues(i) - dMinY) * ratioY
element = (xElement - 1) * yCut + yElement
If (element < LBound(FitValues)) Then element = LBound(FitValues)
If (element > UBound(FitValues)) Then element = UBound(FitValues)
FitValues(element) = z
Next
Dim lastVal As Double
'Find the first value and set lastVal equal to it
For i = LBound(FitValues) To UBound(FitValues)
If FitValues(i) <> MISSING_VAL Then
lastVal = FitValues(i)
Exit For
End If
Next
'Make sure there aren't any blank values
For i = LBound(FitValues) To UBound(FitValues)
If FitValues(i) = MISSING_VAL Then
FitValues(i) = lastVal
Else
lastVal = FitValues(i)
End If
Next
'status set to 1 indicates success
status = 1
End If
End Sub
- Macro results
- Once the user has selected the variables to use from the active spreadsheet, a graph is created with the user-defined fit defined in the macro. In this example, the macro was run using the example data file Exp.sta.
As long as the macro is running, SuperFit can be selected in the Fit type drop-down list on the Plot: Fitting tab of the Graph Options dialog box for this graph.


