General Approach
The charts provided in this module are similar to multivariate generalizations of univariate charts (for continuous variables), as described in the topic Quality Control Introductory Overview - General Approach. The logic, operation, and interpretation of multivariate charts is similar to the application of standard Shewhart control charts, such as X-bar and R charts. However, instead of tracking successive individual measurements (in an X and MR chart) or sample means and ranges (standard deviations) for a single variable, you track a vector of observations or sample means for several variables simultaneously, and the variance/covariance matrix for those observations or means to control the overall variability of the process (measured by multiple variables).
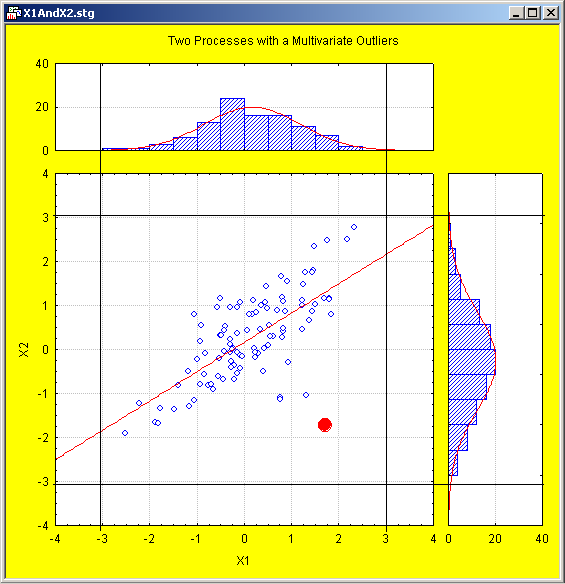
The following figure illustrates the reason why multivariate control charting often is more effective than simple charting of individual variables.
Two variables, X1 and X2, are shown. Both variables follow normal distribution, and it is apparent that the standard +/- 3 times sigma control lines, applied to each individual variable, does not detect any quality problems (outliers) for either one of the two variables.
However, it is apparent that a few points deviate from the common pattern, which best summarizes as a simple linear relationship between the two variables. If the two variables X1 and X2 are being monitored using standard X-bar and R charts (one for each variable), no quality problem is detected.
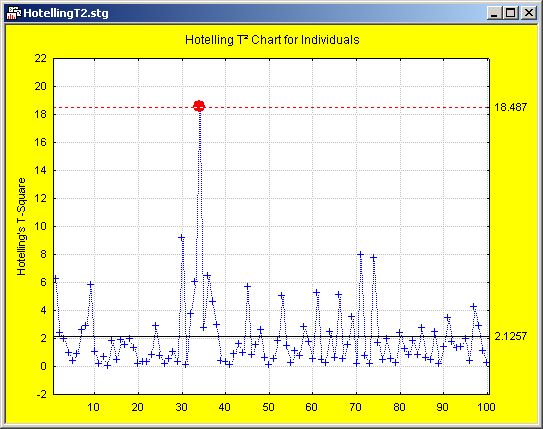
However, if the same data are charted in a Hotelling T2 chart, at least one multivariate outlier is detected.
This example illustrates the basic power of the multivariate approach. By observing and charting essentially the distance of a sample or point from all other points (normal multivariate observations, when the process is in control), changes and quality problems can be detected that would otherwise go unnoticed if one were to rely on traditional univariate control charting alone.


