GDA - Example 2: Best-Subset Discriminant Analysis
This example illustrates model building in GDA using best-subset selection of predictor variables; the analysis will also include a categorical predictor variable. When categorical predictor variables or effects have more than a single degree of freedom, the stepwise and best-subset procedures in STATISTICA GDA ensure that the coded (sigma-restricted) variables representing the categorical predictors are moved in or out of the model as a block (so that always complete multi-degree of freedom effects are included or excluded from the final model; however, in the example below the categorical predictor variable only has two levels, and hence a single degree of freedom). However, refer to the Note of caution for models with categorical predictors, and other advanced techniques, in GDA Introductory Overview - Advantages of GDA, to learn about the possible limitations of including categorical predictors in discriminant analysis problems.
This example illustrates an analysis of the Boston housing data (Harrison & Rubinfeld, 1978) that was reported by Lim, Loh, and Shih (1997). Median prices of housing tracts were classified as Low, Medium, or High on the dependent variable Price. There was 1 categorical predictor, Cat1, and 12 ordered predictors, Ord1 through Ord12. A duplicate of the analysis sample (called learning sample here) is used as a cross-validation (or test) sample. The sample identifier variable is Sample and contains codes of 1 for Learning and 2 for Test. The complete data set containing a total of 1012 cases is available in the example data file Boston2.sta.
- Specifying the Analysis
- Open the Boston2.sta data file and start the General Discriminant Analysis (GDA) Models module:
Ribbon bar. Select the Home tab. In the File group, click the Open arrow and select Open Examples to display the Open a STATISTICA Data File dialog box. The Boston2.sta data file is located in the Datasets folder. Then, select the Statistics tab. In the Advanced/Multivariate group, click Mult/Exploratory and from the menu, select General Discriminant to display the General Discriminant Analysis (GDA) Models Startup Panel.
Classic menus. From the File menu, select Open Examples to display the Open a STATISTICA Data File dialog box. The Boston2.sta data file is located in the Datasets folder. Next, from the Statistics - Multivariate Exploratory Techniques submenu, select General Discriminant Analysis Models to display the General Discriminant Analysis (GDA) Models Startup Panel.
Select General discriminant analysis as the Type of analysis and Quick specs dialog as the Specification method. Then click the OK button to display the GDA General Discriminant Analysis dialog box.
On the GDA General Discriminant Analysis - Quick tab, click the Variables button to display the variable selection dialog box.
Select Price as the categorical Dependent variable, Cat1 as a Categorical pred. variable, and Ord1 through Ord12 as Continuous pred. variables. (Note you may need to clear the Show appropriate variables only check box.) Click the OK button.
In the GDA General Discriminant Analysis dialog box, click the Dep. var. codes button to display the Select Codes for Dependent Variable dialog box. Click the All button and then the OK button to select all codes for the dependent variable.
In the same manner, click the Factor codes button and select all codes for the categorical predictor variable.
On the Advanced tab, click the Cross-validation button to display the Cross-Validation dialog box.
Click the Sample Identifier Variable button and select the variable Sample as the sample indicator variable (to distinguish between the analysis and cross-validation samples). Click the OK button in the Cross-Validation Specifications dialog box.
Next, in the Cross-Validation dialog box, select the text label Learning as the Code for analysis sample to identify the cases in the analysis sample. Then, select the ON option button in the Status group box, and click the OK button to return to the Advanced tab.
Select both the Best subset option button and the Crossval. misclass. option button in the Model building options group to request that the misclassification rate in the cross-validation sample be used to determine the best subset. Note that in this particular data file, the cross-validation sample is simply a duplicate of the analysis sample, so from an analytic point of view using the cross-validation sample in this case wouldn't be necessary (we could simply exclude the Testing sample from the analysis). However, to illustrate this powerful data mining technique, let us proceed in this manner.
Note: by default, when there are 13 predictor effects to choose from, there are 8191 models with 1 to 13 predictors that can be evaluated. To reiterate, STATISTICA will choose the model that yields the best misclassification rate in the cross-validation sample (which in this case happens to be identical to the analysis sample).Finally, click the OK button on the GDA General Discriminant Analysis dialog to display the GDA Models Results dialog. Note that depending on the specifications of your computer, this analysis may take some time to complete because there are so many models to evaluate.
GDA;
DEPENDENT = PRICE ("LOW" "MEDIUM" "HIGH");
GROUPS = CAT1(0 1);
COVARIATE = ORD1 ORD2 ORD3 ORD4 ORD5 ORD6 ORD7 ORD8 ORD9 ORD10 ORD11 ORD12;
DESIGN = ORD1 + ORD2 + ORD3 + ORD4 + ORD5 + ORD6 +
ORD7 + ORD8 + ORD9 + ORD10 + ORD11 + ORD12 +
CAT1;
SAMPLE = SAMPLE (1);
MBUILD = BESTSUBSET;
BESTCRIT = CROSSVAL;
START = 1;
STOP = 13;
MAXSUB = 10;
- Reviewing Results
- On the
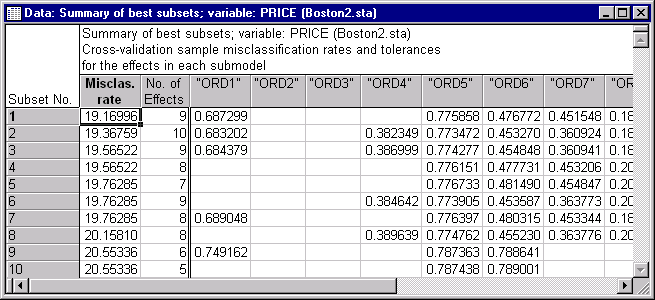
GDA Models Results - Quick tab, click the Summary of best subsets search button in the Model building results group box to display a spreadsheet that contains a summary for the best subset regression analysis.
See also GRM - Index.

