Advanced Example 2: Planned Comparisons of Least Squares Means
This example illustrates planned comparisons of least square means. The data for this example are described by Harvey (1960) and are available in the Weight.sta data file. The data are from a two-factor experiment with Ration at two levels and Sire at three levels. Responses on the dependent variable Weightgain represent coded weight gain. Case number 8 (the single case in the Ration level 2 - Sire level 3 cell) has been deleted to make the design a 2 x 3 full-factorial design with 1 missing cell.
Ribbon bar. Select the Home tab. In the File group, click the Open arrow and select Open Examples to display the Open a STATISTICA Data File dialog box. The Weight.sta data file is located in the Datasets folder. Then, select the Statistics tab. In the Advanced/Multivariate group, click Advanced Models and on the menu, select General Linear to display the General Linear Models (GLM) Startup Panel.
Classic menus. On the File menu, select Open Examples to display the Open a STATISTICA Data File dialog box. The Weight.sta data file is located in the Datasets folder. Next, on the Statistics - Advanced Linear/Nonlinear Models submenu, select General Linear Models to display the General Linear Models (GLM) Startup Panel.
Select General linear models as the Type of analysis and Quick specs dialog as the Specification Method. Then, click the OK button to display the GLM General linear models Quick Specs dialog box.
On the Quick tab, click the Variables button to display a standard variable selection dialog box. Specify Weightgain as the Dependent variable, Ration and Sire as the Categorical pred. variables, and then click the OK button.
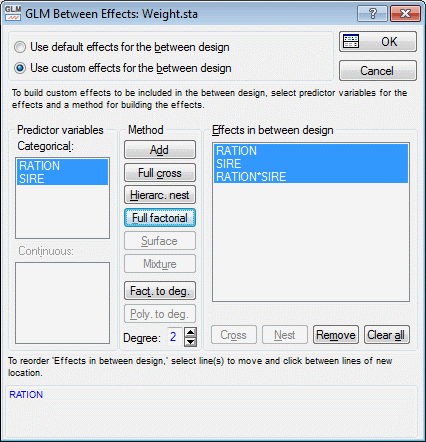
Click the Between effects button. In the GLM Between Effects dialog box, select the Use custom effects for the between design option button.
In the Predictor variables group box, select all the variables. In the Method group box, click the Full factorial button.
Click the OK button, and in the GLM General linear models dialog box, click the OK button. A note will be displayed. Click the OK button to proceed to the GLM Results dialog box.
- Results
- On the
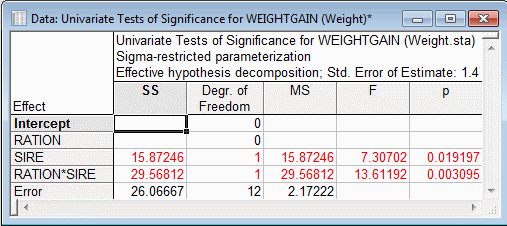
Quick tab, click the All effects button to create the ANOVA summary table using the sigma-restricted parameterization and Type VI sums of squares.
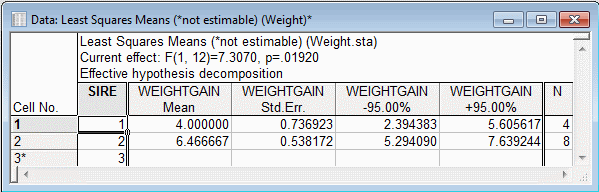
The Ration main effect is not testable and only 1 comparison of estimable least squares (marginal) means is possible for the Sire main effect (i.e., the effect has a single degree of freedom).
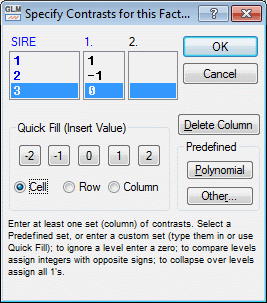
Specify a single-degree of freedom planned comparison of Sire level 1 versus Sire level 2. On the Comps tab, select Sire as the Effect, and then click the Contrasts for LS means button to display the Specify Contrasts for this Factor dialog box. Enter the contrasts as shown below.
Click the OK button in the Specify Contrasts for this Factor dialog box.
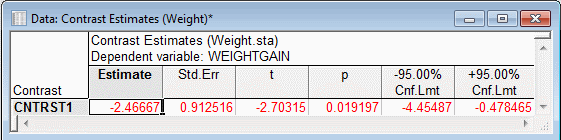
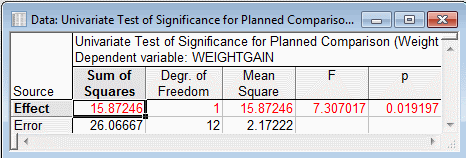
On the Comps tab of the GLM Results dialog box, click the Compute button. The significance of the contrast estimate and the significance of the sums of squares accounted for by the contrast are equal to the significance of the Sire main effect in the ANOVA summary table.
Note: the contrast estimate equals the difference of the Sire level 2 least squares mean from the Sire level 1 least squares mean. (On the Means tab, select the Sire Effect and click the Least squares means button.)In other general linear model programs, the contrasts that are reported in missing cell designs actually test Type IV hypotheses rather than differences in estimable least squares (marginal) means. For example, in these other general linear model programs, if you specify for the Sire main effect two simple comparisons of level 2 of Sire and level 3 of Sire against level 1 of Sire, the contrast estimates do not reflect differences in estimable least squares (marginal) means. Instead, the two contrast estimates reflect 1) the difference of the Ration level 2 - Sire level 2 cell mean from the Ration level 2 - Sire level 1 cell mean, and 2) the difference of the Ration level 2 - Sire level 3 cell mean from the Ration level 2 - Sire level 1 cell mean. These so-called main effect contrasts and their tests of significance actually correspond to Fisher LSD tests of differences in observed cell means.
In the GLM Results dialog box, click the More results button to display the larger Results dialog box that contains more tabs.
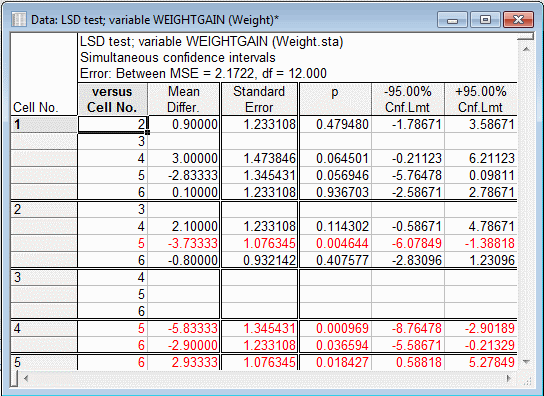
On the Post-hoc tab, select the Ration*Sire Effect. In the Display group box, select the Confidence intervals option button. Then, click the Fisher LSD button.
The mean differences and the confidence limits (apart from their signs) and the tests of significance for the so-called main effect contrasts are equal to the respective results for the cell 4 versus cell 5 and the cell 4 versus cell 6 comparisons.
See also GLM - Index.