Common Elements of Recorded Macro (SVB) Programs
The macro (SVB) programs recorded by Statistica use several common elements in addition to the properties and methods that are specific to the particular analysis objects. For example, almost all analyses require you to specify one or more variable lists, and in some cases sets of codes to identify groups in the input data. Also, each analysis has specific options relevant to the particular analysis, such as the specifications for censoring in Survival Analysis, which is not relevant to analyses available in Basic Statistics.
- Creating the analysis object
- Each recorded macro begins with declaring the new analysis object; the analysis begins by creating the new object (see also
The Statistica VB Object Model). For example, a macro recorded from an analysis via the Basic Statistics module begins with:
Set newanalysis = Analysis (scBasicStatistics)
In this statement, variable newanalysis is (implicitly) declared as an Analysis object. The constant scBasicStatistics causes an analysis of type Basic Statistics to be created. Refer to Statistica Libraries and Modules for a complete listing of analysis constants, and the types of analyses that they create.
The With ... End With block; specifying dialogs. If you have looked at a few recorded macro (SVB) programs, you will have noticed that practically all of them include With ... End With blocks. This is a shortcut method for setting the options (properties) in a particular dialog box. In general, the specification:
With newanalysis.Dialog
.Variables = "5 6 7 8" .ConfidenceIntervalForMeansPlot = 95 .CompressedStemAndLeaf = False
End With
is equivalent to specifying these three options like this:
newanalysis.Dialog.Variables = "5 6 7 8" newanalysis.Dialog.ConfidenceIntervalForMeansPlot = 95 newanalysis.Dialog.CompressedStemAndLeaf = False
The With .. End With block is recorded 1) when you move forward to the next dialog box or back to the previous dialog box (via .Run or .GoBack; see also below), 2) when you explicitly request that the macro be written out to the SVB program editor, or 3) whenever you select an output method, i.e., create results spreadsheets or graphs. In the latter case, to make the recorded macro (SVB) programs more compact, the program will automatically analyze which properties have changed from one results spreadsheet (or graph) to the next, and only record those properties that have changed (if any).
- Specifying variables and variable lists
- Variables are recorded as a string of variable numbers, which is assigned to the .Variables property; when multiple variable lists are recorded (e.g., a list of dependent variables and a list of independent variables), then the string contains the vertical bar character ( | ) to separate the lists:
With newanalysis.Dialog
.Variables = "5 6 7 8 | 1 2 3 4"
'...
Note: the .Variables property can be set by specifying numbers and variable names, as well as variables of type Variant (see Statistica Visual Basic (SVB) Programming Environment). Refer to Editing and Customizing Recorded Macro (SVB) Programs for additional details. - Specifying lists of codes
- Several types of analyses call for the specification of codes. For example, in the Basic Statistics module, the Breakdown & one-way ANOVA option allows you to specify a list of dependent variables (for which to compute the breakdown statistics), and a list of grouping variables (categorical predictor variables, class-identifier variables) by which to break down the analysis (e.g., to compute descriptive statistics by gender). Here is an example taken from a recording of an analysis via the Breakdown option in Basic Statistics.
With newanalysis.Dialog
.Variables = "5 6 7 8 | 1 2" .Codes = "EXPERMTL-CONTROL | MALE-FEMALE"
End With
The .Codes property is usually set by assigning to it a string. In this specific example, the codes are identified by 8-character short text labels. They can also be specified as code numbers (i.e., as the actual integer codes that were used in the data file to identify groups):
.Codes = "1 2 | 1 2"
When the text labels contain special embedded characters such as spaces, you will see double-quotation marks to distinguish between the different labels:
.Codes = """Experimental group""-""Control group"" | ""MaleParticipants""-""Female participants"""
Note: the .Codes property can be set by specifying numbers or text labels, as well as variables of type Variant (see Statistica Visual Basic (SVB) Programming Environment). Refer to Editing and Customizing Recorded Macro (SVB) Programs for additional details.Finally, the .Codes properties can also simply be omitted. Remember that the automation model for the Statistica modules follows the flow of dialogs in the interactive analysis, and when you run, for example, the Breakdown analyses interactively, you will notice that you do not have to specify the code values explicitly. By default, the program will determine the (integer) codes found in the respective variables in the data file. Hence, if you omit the .Codes property from the automation, then the program will do the same thing, i.e., determine the codes from the values found in the input data file.
- Specifying single codes
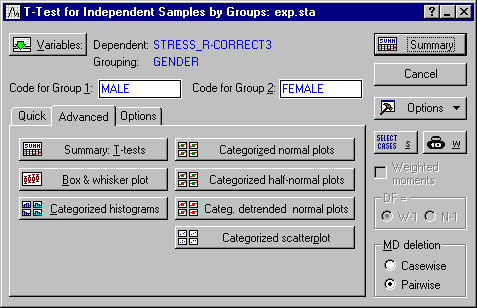
- Some dialog boxes contains edit fields for specifying single code values to identify a particular group in the data. For example, the T-test for Independent Samples by Groups dialog box in the Basic Statistics module contains two such edit fields for specifying the numeric codes or text labels for the grouping variable to identify the groups for the t-test.
These fields would be recorded in the With ... End With block representing this dialog box in the following manner:
With newanalysis.Dialog
.Variables = "5 6 7 8 | 2" .CodeForGroup1 = "MALE" .CodeForGroup2 = "FEMALE" '...
End With
Note that, as is the case when specifying lists of codes, the properties .CodeForGroup1 and .CodeForGroup2 can also be set by assigning individual values (e.g., .CodeForGroup1=1). When the text labels for a variable contain embedded spaces or other special characters, the text labels assigned to the respective property will be enclosed in double quotation marks; for example:
.CodeForGroup1 = """MaleParticipants""" .CodeForGroup2 = """Female participants"""
Note: the single-code selection property can also be set by assignment of a variable of type Variant (see The variant data type). Refer to Editing and Customizing Recorded Macro (SVB) Programs for additional details. - Check boxes, option buttons, numeric input fields
- Each With ... End With block contains the options and settings from the respective dialog. Most dialog boxes contain various check boxes, groups of option buttons, list boxes, numeric input fields, etc. These options are usually reflected and set inside the respective With ... End With block in a straightforward manner. For example, the T-test for Independent Samples by Groups dialog box in Basic Statistics would be recorded as follows:
With newanalysis.Dialog
.Variables = "5 6 7 8 | 2" .CodeForGroup1 = "MALE" .CodeForGroup2 = "FEMALE" .PairwiseDeletionOfMD = True .DisplayLongVariableNames = True .TTestWithSeparateVarianceEstimates = False .MultivariateTest = False .Levene = False .BrownForsythe = False .PLevelForHighlighting = 0.05
End With
Check boxes and option buttons are checked or cleared by assigning True or False to the corresponding property. Instead of True or False, these properties can be set by assigning 1 or 0, respectively. Numeric input fields are set by assigning the respective values (e.g., PlevelForHighlighting = 0.05). As with all properties in SVB, properties corresponding to dialog check boxes or option buttons can also be set by assignment of a variable of type Boolean, Integer, Long, or Variant, and properties corresponding to numeric input fields can be set by assigning variables of the appropriate type (e.g., Double for fields that accept floating point values). Refer to Editing and Customizing Recorded Macro (SVB) Programs for additional details.
- Specifying pairwise and casewise deletion of missing data
- A common option (property) that is used in several types of analyses is the treatment of missing data values. Missing data can usually be deleted casewise or listwise (a case is excluded from the analysis if it has missing data for any of the variables in any of the lists of variables in the analysis) or pairwise (cases are excluded only from those computations involving variables that contain missing data; this often results in different numbers of valid cases for different variables in the analysis); occasionally, another option is to replace the missing data with the respective means.
.PairwiseDeletionOfMD = True
Instead of .PairwiseDeletionOfMd, you may see .CasewiseDeletionOfMD, or .MeanSubstitutionOfMD to denote the respective choice of how to handle missing data. As with all check boxes and option buttons, instead of True or False, you could also assign 1 or 0, respectively, to the properties, or you can assign a variable computed in some other part of a larger program.
- Combo boxes, list boxes: Using symbolic constants
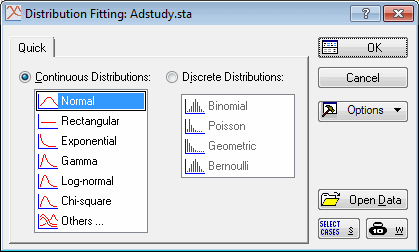
- Some dialog boxes contain combo boxes ("pull-down lists") or list boxes with several items to choose from. For example, the Distribution Fitting module displays the following Startup Panel:
This dialog box contains two list boxes with several distributions to choose from. If you select the Normal distribution, the Fitting Continuous Distributions dialog box is displayed.
Here you can still change to a different continuous distribution by selecting a different option in the Distribution list. The choices illustrated above would be recorded as follows:
Set newanalysis = Analysis (scDistributions) With newanalysis.Dialog
.FitContinuousDistributions = True .ContinuousDistribution = scNonNormal
End With newanalysis.Run With newanalysis.Dialog
.Variable = "6" .Distribution = scNonGamma '...
End With
Note the use of the symbolic constants scNonNormal and scNonGamma. These are constants that can be substituted by simple values to indicate relative position of the respective choices in the list of choices. So for example, scNonNormal is the first choice in the list of options in the Continuous distributions box in the Startup Panel; scGamma is the fourth choice in the list in the Fitting Continuous Distributions dialog box. Because in SVB all enumerations, by default, begin with 0 (and not 1), you could replace these two constants with the values 0 and 3, respectively; so you could also write:
.ContinuousDistribution = 0 .Distribution = 3
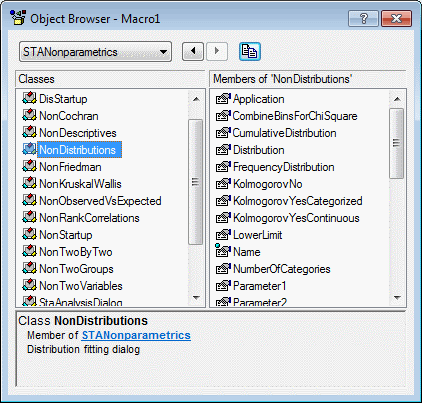
The symbolic constants available in a particular dialog box can be reviewed in the Object Browser.
Select the respective object library (note that the Distribution Fitting module is contained in the Nonparametrics library; see Statistica Libraries and Modules for a complete listing of analysis modules and libraries), select an Enumeration in the left panel, and then scroll in the right panel to the constants available for that enumeration.
Moving forward (clicking OK); moving backward (clicking Cancel); moving sideways. When running an analysis interactively, a sequence of dialog boxes is presented with options for each step of the analysis, and the user can move back and forth to make modifications as desired. Also in some cases, you can move "sideways" between dialogs; for example, in the Multiple Regression Results dialog box, there is an option to move to the Review Descriptive Statistics dialog box; once you Cancel out of that dialog box, you will return to the Multiple Regression Results dialog box. Shown below is a part of a typical macro recording those "movements," based on a recording of an analysis with the Multiple Regression module.
Set newanalysis = Analysis (scMultipleRegression) With newanalysis.Dialog
.RegressionMode = scRegLinearRegression .Variables = "5 | 6 7 8"
End With newanalysis.Run With newanalysis.Dialog
'.... '....
End With newanalysis.Dialog.ReviewDescriptiveStatistics With newanalysis.Dialog
'....
End With newanalysis.GoBack With newanalysis.Dialog
'...
End With newanalysis.Run With newanalysis.Dialog
'...
End With newanalysis.GoBack With newanalysis.Dialog
'...
End With
The newanalysis.Run method causes the program to "move forward"; in a sense the .Run method "clicks" the OK button. The statement newanalysis.Dialog.ReviewDescriptiveStatistics is the recording of a "sideways" move; in this particular instance, it moves from the Multiple Regression Results dialog box to the Review Descriptive Statistics dialog box. The newanalysis.GoBack method is the equivalent of clicking Cancel, and thus causes the analysis to "go back" to the previous dialog box.
- Results variables, results selections
- In some instances, when you select an option to create a results spreadsheet or graph, one or more dialog boxes are displayed to prompt you to select additional specifications for the selected result. For example, when you create Interaction plots from the Statistics by groups (Breakdown) Results dialog box, and you have multiple dependent variables and multiple categorical predictors selected for the analysis, a series of dialog boxes is displayed, to 1) select one or more of the dependent variables, and 2) select the order of factors for the plot via a two-list selection dialog box titled Arrangement of factors (use this dialog box to assign the factors to the lower and upper x-axis labels in the plot). These selections will be recorded via the respective dialog's .ResultsVariables and .ResultsSelection properties, respectively; for example:
'...
With newanalysis.Dialog
'...
End With newanalysis.Dialog.ResultsVariables = "6 7" newanalysis.Dialog.ResultsSelection = "1 | 2 " newanalysis.Dialog.CategorizedMeansInteractionPlots._ Visible = True
Here the macro recorded the selection of results variables 6 and 7, and further ResultsSelection 1 and 2, i.e., when you run the program, the first element in the first list (of the two-list selection dialog) will be selected, and the second element in the second list.
- ResultsValues
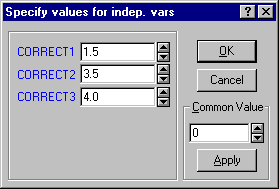
- There are some results spreadsheets and graphs that require you to enter a set of values before the results can be computed. For example the Multiple Regression Results dialog box contains options for computing predicted values for a set of predictor variable values. When you click the Predict dependent variable button on the Multiple Regression Results dialog box - Residuals/assumptions/prediction tab, the following dialog box is displayed, in which you specify the independent variable values (in this illustration there are three predictor variables Correct1, Correct2, and Correct3).
When you click OK, the predicted value for these independent variable values are computed. When you record a macro to document this analysis, this results option is recorded as follows:
newanalysis.Dialog.ResultsValues = "1.5 3.5 4 " newanalysis.Dialog.PredictDependentVar.Visible = True
Note: the .ResultsValues property can also be set (1) by assigning a single value, in which case all independent variables will be set to that value, (2) by assigning an array of values, or (3) by assigning an array of type Variant with values.


