Example 5: Wald-Wolfowitz Runs Test, Mann-Whitney U Test, Kolmogorov-Smirnov Two-Sample Test
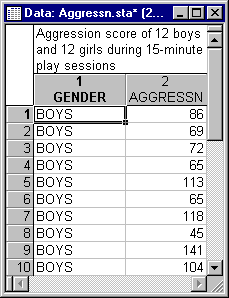
These tests are alternatives to the t-test for independent samples (see Basic Statistics and Tables). Refer to the Wald-Wolfowitz Runs Test, Mann-Whitney U Test, and Kolmogorov-Smirnov Two-Sample Test topics for a discussion of the logic and assumptions of these tests. This example is based on a study of gender differences in aggressiveness of four-year-old boys and girls (Siegel, 1956, page 138). These data are contained in the Aggressn.sta data file, which is partially shown in the illustration below). Open this data file via the File - Open Examples menu; it is in the Datasets folder.
Twelve boys and twelve girls were observed during two 15-minute play sessions; each child's aggressiveness was scored (in terms of frequency and degree) during those sessions and a combined single aggressiveness index was derived for each child.
- Specifying the analysis
- Select Nonparametrics from the Statistics menu to display the Nonparametric Statistics Startup Panel. Next, select Comparing two independent samples (groups) on the Quick tab, and then click the OK button to display the Comparing Two Groups dialog. Click the Variables button to display the standard variable selection dialog. From the Dependent variable list, select variable Aggressn; from the Indep. (grouping) variable list, select variable Gender, and then click the OK button. The codes that were used to uniquely identify the subjects' gender will automatically be selected by STATISTICA once the variables have been identified.
- Reviewing the results
- Now, click the Wald-Wolfowitz runs test button to perform the analysis.
The difference between boys and girls in this study with respect to aggressiveness is highly significant (see Elementary Concepts, for a discussion of statistical significance testing), regardless of which test is used. Return to the Comparing Two Groups - Quick tab and click both the Kolmogorov-Smirnov two-sample test button and the Mann-Whitney U test button to view those results.
The default graph for these tests is the box plot. Display the default graph by clicking the Box & whisker plot by group button on the Quick tab. When you click this button, the standard variable selection dialog is first displayed. Here, select the Aggressn variable and then click the OK button.
The box plot indicates, for the dependent variable, the median, quartiles (25th and 75th percentiles), and range (minimum and maximum) for each category of the grouping variable.
It is apparent from this plot (and the one below) that boys were more aggressive than girls. In order to view the distribution of the dependent variable as categorized by the grouping variable, click the Categorized histograms by group button. When you click this button, the standard variable selection dialog is first displayed. Select the Aggressn variable and then click the OK button.
See also, Nonparametric Statistics - Index.


