Example 11: MANCOVA Design
A multivariate analysis of variance design with multiple (fixed) covariates will be specified in this example. The homogeneity of slopes (or parallelism) hypothesis will be tested and the standard multivariate results will be computed.
- Data file
- This example is based on a data set reported by Finn (1974). Four groups of 12 subjects each were asked to sort a list of 50 words (each printed on one card) into a specified number of categories. The experimental groups differed with regard to the instructions they received concerning the number of categories represented in the word lists, and the actual number of categories in the word lists (as "built" into them by the experimenter). Specifically, the four groups differed as follows:
- subjects in group 1 were told to sort the word list into 5 major categories, each containing 2 sub-categories (condition M5_S2);
- subjects in group 2 were instructed to sort the same words into 10 major categories, and no sub-categories were mentioned (condition M10_S0);
- subjects in group 3 were told to sort the same word list into 5 major categories, and no sub-categories were mentioned (M5_S0);
- subjects in group 4 were instructed in the same manner as subjects in group 3, however, the word list did not contain any salient or intended (by the experimenter) structure (Control group; M5_S0_C).
The major dependent variables are 1) the number of words recalled after six trials of sorting and 2) the percentage of categories (intended by the experimenter) recreated by the subjects in their sorts. The amount of time (in seconds) that subjects spent on their 2nd, 4th, and 6th sorting trials was recorded and served as covariates in the design.
These data are contained in the example data file Mancova.sta. A portion of that file is reproduced below.
Variable 1 (Group) contains the codes that identify to which experimental group each subject belongs; variable 2 (Words) contains the number of words recalled; variable 3 (Cats) contains the percent of intended categories reproduced by subjects; variables 4 through 6 (Time2 to Time6) contain the amount of time spent by the respective subject on the 2nd, 4th, and 6th sorting trial, respectively.
- Specifying the analysis
- First we will test the
homogeneity of slopes (or parallelism) hypothesis to determine whether a separate-slopes or a traditional MANCOVA design should be used to model the data.
Ribbon bar. Select the Home tab. In the File group, click the Open arrow and select Open Examples to display the Open a STATISTICA Data File dialog box. The Mancova.sta data file is located in the Datasets folder. Then, select the Statistics tab. In the Advanced/Multivariate group, click Advanced Models and from the menu, select General Linear to display the General Linear Models (GLM) Startup Panel.
Classic menus. From the File menu, select Open Examples to display the Open a STATISTICA Data File dialog box. The Mancova.sta data file is located in the Datasets folder. Next, from the Statistics - Advanced Linear/Nonlinear Models submenu, select General Linear Models to display the General Linear Models (GLM) Startup Panel.
Select Homogeneity-of-slopes model as the Type of analysis and Quick specs dialog as the Specification method. Then click the OK button to display the GLM Homogeneity-of-Slopes Quick Specs dialog box.
Click the Variables button to display the standard variable selection dialog box. Select Words and Cats as the Dependent variables, Group as the Categorical pred. variable, and Time2, Time4, and Time6 as Continuous pred. variables. Then click the OK button to return to the GLM Homogeneity-of-Slopes Quick Specs dialog box. The remainder of the specifications for the analysis can use the default specifications, so click the OK button to run the analysis.
A warning dialog box will be displayed. For information about this warning, see the GLM Introductory Overview - Summary of Computations, specifically the paragraph about matrix ill conditioning. Click the OK button in the warning.
Reviewing Results for the Homogeneity of Slopes Model
- Significance of all covariate interactions
- The
GLM Results dialog box will be displayed when the analysis is complete. To obtain multivariate tests of significance for the effects in the model, click the All effects button on the
Quick tab.
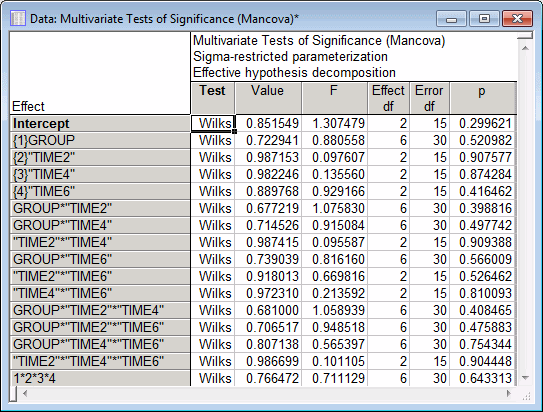
As can be seen, the Group, Time2, Time4 and Time6 main effects do not approach significance (all ps > .5). More importantly, none of the Group-by-covariate interactions or the covariate-by-covariate interactions approach significance (similar results can be found for each dependent variable analyzed separately; click the Univariate results button on the Summary tab to display univariate ANOVAs for each dependent variable). This suggests that the use of a separate-slopes model is unnecessary for adequately representing the influences of the covariates on the outcome.
- Significance of categorical predictor by covariate interactions
- The default
homogeneity of slopes model in STATISTICA
GLM is very comprehensive; it provides tests of significance for all categorical predictor-by-covariate interactions and also for all covariate-by-covariate interactions. In discussing the analysis of this data set, Finn (1974) presents a simultaneous test of the more limited hypothesis that there are no significant 2-way categorical predictor-by-covariate interactions.
Now, modify the analysis by specifying a design to test only that there are no significant 2-way categorical predictor-by-covariate interactions.
In the GLM Results dialog box, click the Modify button to return to the GLM Homogeneity-of-Slopes Quick Specs dialog box, and then click the Syntax editor button to display the GLM Analysis Syntax Editor. In the Analysis syntax field, change the DESIGN statement to read:
DESIGN = GROUP + TIME2 + TIME4 + TIME6 + GROUP*TIME2 + GROUP*TIME4 + GROUP*TIME6;
Then click the OK (Run) button to run the modified analysis. When the GLM Results dialog is displayed, click the All effects button on the Quick tab to produce the spreadsheet of Multivariate Tests of Significance for the effects in the model.
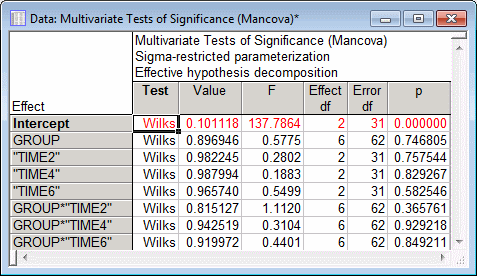
The results in the spreadsheet show that none of the 2-way categorical predictor-by-covariate interactions, tested separately, approach significance (ps > .30, similar results are found for each dependent variable tested univariately).
To simultaneously test the significance of the 2-way categorical predictor by covariate interactions, click the Estimate button on the Summary tab to display the Specify effect to estimate spreadsheet. In this spreadsheet you can specify coefficients for one or more linear combinations of model parameters to be tested simultaneously. To specify a simultaneous test of the model parameters for all 2-way categorical predictor-by-covariate interactions, in columns 1 through 9 enter 1's in the rows corresponding to the parameters for the 2-way categorical predictor by covariate interactions.
After specifying the coefficients, click the OK button to produce the Multivariate Test of Significance for Estimated Effect E0 spreadsheet.
The simultaneous test of the model parameters for all 2-way categorical predictor-by-covariate interactions does not approach significance, p > .50, again suggesting that the use of a separate-slopes model is unnecessary for adequately representing the influences of the covariates on the outcome.
- Reviewing Results for the Separate Slopes Model
- Although fitting the
separate slopes model is unnecessary for this data set, we will illustrate its use for this example.
Start a new General Linear Models analysis.
Ribbon bar. Select the Statistics tab. In the Advanced/Multivariate group, click Advanced Models and from the menu, select General Linear.
Classic menus. From the Statistics - Advanced Linear/Nonlinear Models submenu, select General Linear Models.
When the Starting Duplicate Analysis dialog box is displayed, click the Start new button to display another General Linear Models (GLM) Startup Panel.
Select Separate-slopes model as the Type of analysis, Quick specs dialog as the Specification method, and then click the OK button to display the GLM Separate-Slopes Model Quick Specs dialog box.
Click the Variables button, select Words and Cats as the Dependent variables, Group as the Categorical pred. variable, and Time2, Time4, and Time6 as Continuous pred. variables. Then click the OK button to return to the GLM Separate-Slopes Model Quick Specs dialog box. The remainder of the specifications for the analysis can use the default specifications, so click the OK button to run the analysis.
- Multivariate tests of significance
- The
GLM Results dialog box will be displayed when the analysis is complete. To obtain
multivariate tests of significance for the effects in the model, on the Quick tab, click the All effects button.
Consistent with the results of the tests of the homogeneity of slopes hypothesis, none of the categorical predictor-by-covariate 2-way interactions approach significance, p's > .50 (similar results are found for each dependent variable tested univariately).
- Reviewing Results for the Traditional MANCOVA model
- Now specify the traditional MANCOVA model, which includes only the main effects of the continuous predictor variables.
Start a new GLM analysis, and click the Start new button in the Starting Duplicate Analysis dialog box to display another General Linear Models (GLM) Startup Panel.
Select Analysis of covariance as the Type of analysis, Quick specs dialog as the Specification method, and then click the OK button to display the GLM Analysis of Covariance Quick Specs dialog box.
Click the Variables button, select Words and Cats as the Dependent variables, Group as the Categorical pred. variable, and Time2, Time4, and Time6 as Continuous pred. variables. Then click the OK button to return to the GLM Analysis of Covariance Quick Specs dialog box.
The remainder of the specifications for the analysis can use the default specifications, so click the OK button to run the analysis.
- Multivariate tests of significance
- On the
GLM Results dialog box - Quick tab, click the All effects button.
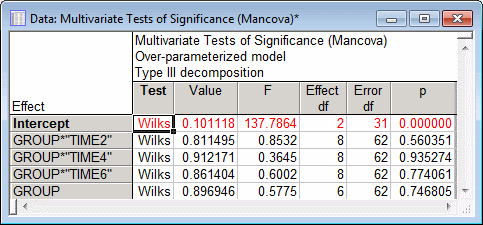
As can be seen, the Group main effect controlling for the main effects of the covariates is significant in this analysis, p < .05.
- Relationship between the separate slopes and analysis of covariance models
- We now can illustrate the relationship between the
homogeneity of slopes and
analysis of covariance models.
On the GLM Results dialog box - Quick tab, click the Whole model R button to display the Test of SS Whole Model vs. SS Residual spreadsheet.
To compare these results with the results for the separate slopes model, click on the previous GLM Results dialog box to bring it to the foreground, and then click the Whole model R button to display the Test of SS Whole Model vs. SS Residual spreadsheet for the separate slopes model.
The differences in the model sums of squares (and cross-products) for these two analyses is precisely what was tested when we performed a simultaneous test of the significance of the 2-way categorical predictor-by-covariate interactions. You can verify this by rerunning the second analysis in this example separately for each dependent variable. The sums of squares for the simultaneous test will equal the difference of the SS Model for the analysis of covariance model from the SS Model for the separate slopes model for the respective dependent variable.
See also GLM - Index.


