Example 4: Correlations
A discussion and comparison of the different nonparametric correlation coefficients (Spearman R, Kendall tau, and Gamma) available in the Nonparametric Statistics module is provided in the Nonparametric Statistics Introductory Overview - Nonparametric Correlations topic. This example is based on a data set reported by Siegel and Castellan (1988, page 238). Open the Striving.sta data file via the File - Open Examples menu; it is in the Datasets folder.
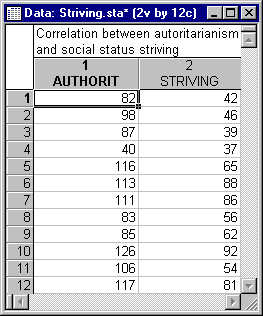
Twelve students completed two questionnaires designed to measure (1) authoritarianism and (2) striving for social status. Authoritarianism (Adorno et al., 1950) is a psychological concept; in short, highly authoritarian people tend to be rigid and believe in authority ("law and order").
The purpose of the study was to find out whether these two variables are correlated.
- Specifying the analysis
- Select Nonparametrics from the Statistics menu to display the Nonparametric Statistics Startup Panel. Next, select Correlations (Spearman, Kendall tau, gamma) on the Quick tab, and then click the OK button to display the
Nonparametric Correlation dialog.
In the Compute box, select Detailed report. Click the Variables button to display the standard variable selection dialog. From the First variable list, select Authorit; from the Second variable list, select Striving, and then click the OK button.
- Reviewing the results
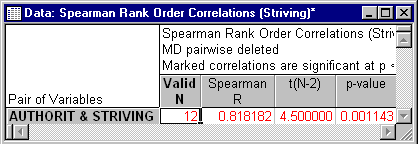
- Now, click the Spearman rank R button to display a spreadsheet with the results of the analysis.
The correlation between the two scales is highly significant (see Elementary Concepts for a discussion of statistical significance testing), and you can conclude that highly authoritarian individuals probably also seek to strive toward social status (provided that the questionnaires are valid).
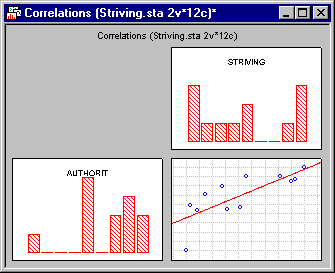
You can visualize the correlation by displaying the default graph in one of two ways. You can either click the Scatterplot matrix for all variables button on the Nonparametric Correlations - Quick tab, or you can right-click on a cell in the Spearman Rank Order Correlations spreadsheet and then select Graphs of Input Data - Scatterplot by - Regression, 95% conf. from the resulting shortcut menu. Note that if you produce this plot via the shortcut menu, only the correlation plot will be displayed. In the illustration shown below (produced by clicking the Scatterplot matrix for all variables button), in addition to the correlation plot (in the bottom, right corner), histograms of the variables are also included.
This same correlation plot can also be displayed in another way, which will provide us with further information. Select Scatterplots from the Graph menu to display the 2D Scatterplots dialog. Then, click the Variables button to display the standard variable selection dialog. Here, select variable Striving as the X, variable Authorit as the Y, and then click the OK button. Then on the Advanced tab, select the Corr. and p (linear fit) check box under Statistics and the Confidence option button under Regression bands. Finally, click the OK button on the 2D Scatterplots dialog to produce the plot.
The parametric correlation (Pearson product-moment correlation) between the two scales (r = 0.77) is shown in the bottom of the scatterplot. Interestingly, this correlation is lower than the Spearman rank order correlation (Spearman R is .82). If the sample size was larger in this instance, you could conclude that treating the information in the data as ranks actually improves the estimate of the relationship between the variables by "blocking out" random variability and dampening the effects of outliers.
- Kendall tau and Gamma
- For comparison, return to the
Nonparametrics Correlation dialog and click on the
Advanced tab. Then, click both the Kendall Tau button and the Gamma button.
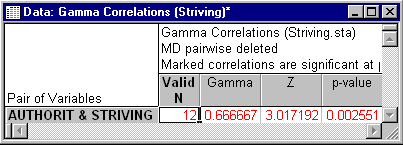
Kendall tau and Gamma are both computed as .67. As discussed in detail in the Nonparametric Statistics Introductory Overview - Nonparametric Correlations topic, these two measures are indeed closely related to each other, but different from Spearman R. Spearman R can be thought of as the regular Pearson product-moment correlation coefficient, that is, in terms of proportion of variability accounted for, except that Spearman R is computed from ranks. Kendall tau and Gamma on the other hand, rather represent probabilities, that is, the difference between the probability that in the observed data the two variables are in the same order versus the probability that the two variables are in different orders.
See also, Nonparametric Statistics - Index.


