Example 3 - Cox Proportional Hazards Model - Models for Recurrent Event Data
Multiple event or recurrent event data is an extension of the single event model. Cancer patients are an example of those subjects that can experience multiple events, that is, the cancer goes into remission and then at a later time can reoccur. In this example, we can look at the different ways we can analyze recurrent event data in Statistica.
The data set for this example, Psoriasis.sta, is taken from Kabat-Zinn et al. (1998) and contains the results of a study that investigated stress reduction techniques in the treatment of psoriasis. There are many ways to analyze this type of data. We discuss four types of methods. In order to account for the correlation within subjects, the Lin and Wei robust estimator of the covariance matrix is used.
Prerequisites
- Ribbon bar:
- Select the Home tab.
- In the File group, click the Open arrow, and select Open Examples to display the Open a Statistica Data File dialog box. The data set is located in the Datasets folder.
- On the Statistics tab, in the Advanced/Multivariate group, click the Advanced Models arrow and select Cox Proportional Hazards to display the Cox Proportional Hazards Regression dialog box.
- Classic Menu
AG Model
The first model that is considered is the AG (Anderson-Gill) or counting process model. This model treats events within a subject as independent and does not distinguish between the first event versus subsequent events.
Procedure
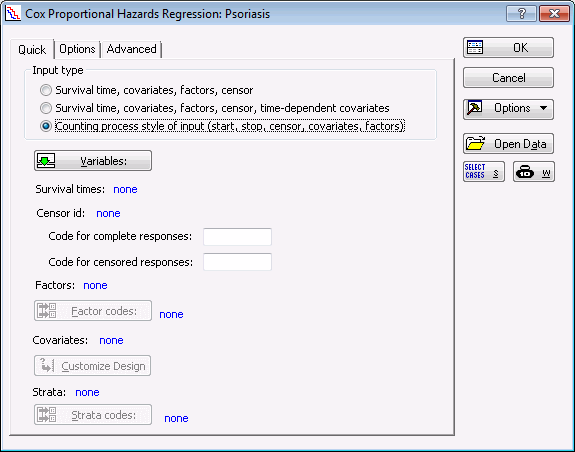
- In the Cox Proportional Hazards Regression dialog box, on the Quick tab, in the Input type group box, select the Counting process style of input (start, stop, censor, covariates, factors) option button.
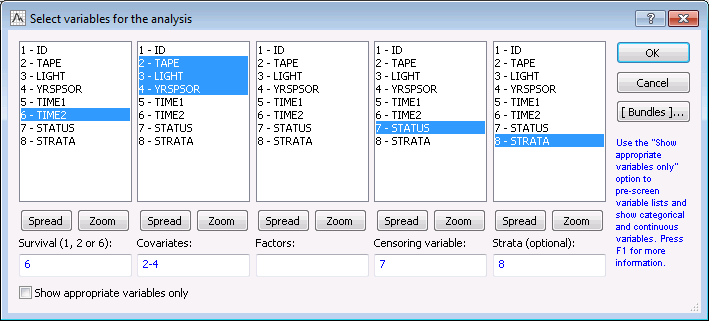
- Click the Variables button, and select variables as shown in the following image.
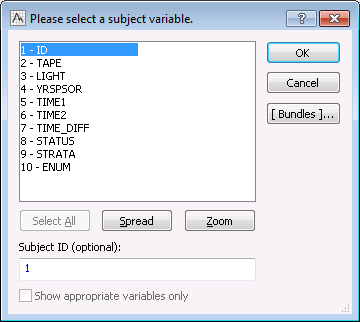
- Select the Robust variance estimator check box, and click the Subject button. In the Select a subject variable dialog box, select variable 1 - ID.
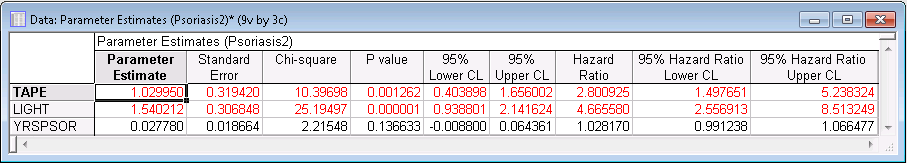
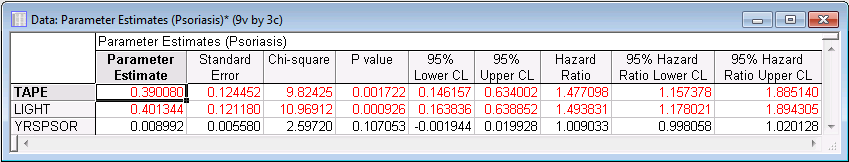
- On the Quick tab, click the Parameter estimates button to produce the coefficients for the AG model.
PWP-CP Model for Recurrent Event Data
The next two models were suggested by Prentice, Williams, and Peterson (1981). Both are referred to as conditional models. They are conditional in the sense that a subject is not considered at risk for the k+1th event until the kth event has occurred. In both models, subjects are stratified by event number. The PWP-CP (CP stands for conditional probability) model uses the actual time the event occurs, whereas, the PWP-GT (GT stands for gap-time) model uses the time since the last event. Both models can be estimated using the stratified proportional hazards model.
PWP-CP Model
Use the Psoriasis.sta data file.
Prerequisites
Click the Modify button in the Cox Proportional Hazards Results dialog box to return to the Cox Proportional Hazards Regression dialog box.
Procedure
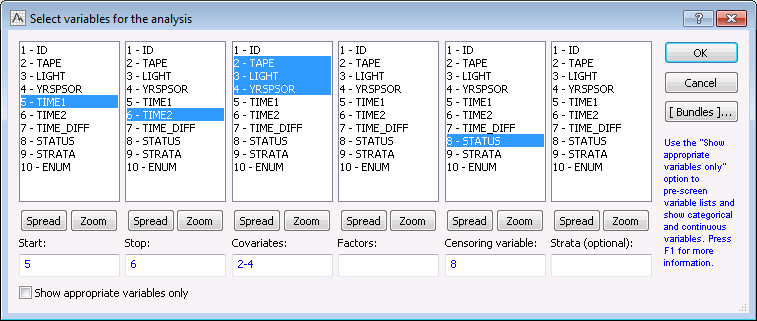
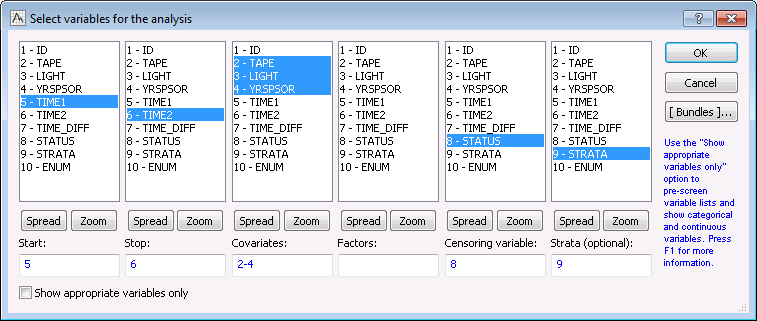
- Click the Variables button, and select variable as shown in the next image. Note that, for the PWP-CP model, a strata variable needs to be selected. The strata variable keeps track of the number of events that have occurred.
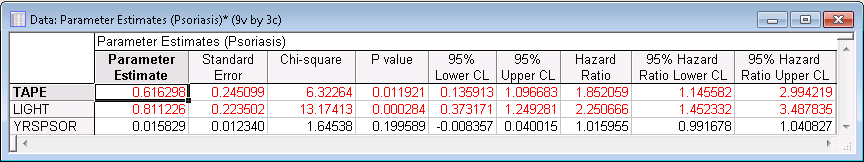
- On the Quick tab, click the Parameter estimates button to produce the coefficients for the PWP-CP model.

PWP-GT Model for Recurrent Event Data

WLW Model for Recurrent Event Data
The next model considered is the model proposed by Wei, Lin, and Weissfeld and is referred to as the WLW model. This model is a marginal model that separately models each event as its own process.
For this model, we need to use another data set. Close all open files, open the Psoriasis2.sta data file, and start the Cox Proportional Hazards module.
This data is the same as the previous except that in the WLW model all subjects are considered at risk for all events. In order to reflect this assumption in the data set, we need to have data on all subjects for each event. As an example, suppose a subject experiences 2 events. The data for the subject might look like:
Suppose that in this data set, the maximum number of events a subject experiences is 4. In the WLW model we would add two rows to the subject as follows.