Five Channels for Output from Analyses
When you perform an analysis, Statistica generates output in the form of multimedia tables (spreadsheets) and graphs.
There are five basic channels to which you can direct all output:
The first four output channels listed above are controlled by the options on the Output Manager tab of the Options dialog box. There are a number of ways to output to the Web, depending on the version of r you have.
These means for output can be used in many combinations ( a workbook and report simultaneously) and can be customized in a variety of ways. Also, all output objects (spreadsheets and graphs) placed in each of the output channels can contain other embedded and linked objects and documents, so Statistica output can be hierarchically organized in a variety of ways. Each of the Statistica output channels has its unique advantages.
Auto save and recovery features
All Statistica documents ( input spreadsheets, workbooks, reports, and macros) that are likely to accumulate the results of your work (data entry, editing, or output collection) over an extended period of time support the Auto Save feature, which is configurable on the General tab of the Options dialog box (accessible by selecting Options on the Tools tab or menu).
This facility will automatically save the contents of your work periodically (every 10 minutes) and, thus, give you the option to retrieve data that otherwise could have been lost in case of a power outage or a system failure.
Workbooks
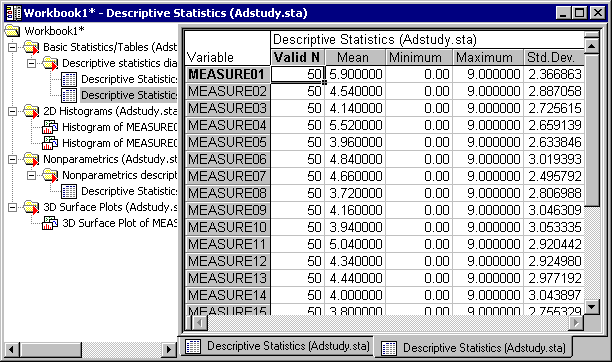
Workbooks are the default way of managing output. Each output document ( a Statistica Spreadsheet or Graph, as well as a Microsoft Word or Excel document) is stored as a tab in the workbook.
Documents can be organized into hierarchies of folders or document nodes (by default, one is created for each new analysis) using a tree view, in which individual documents, folders, or entire branches of the tree can be flexibly managed.

For example, selections of documents can be extracted ( drag-copied or drag-moved) to the report window or to the application workspace ( the Statistica application background where they will be displayed in stand-alone windows). Entire branches can be placed into other workbooks in a variety of ways in order to build specific folder organization, etc.
Technically speaking, workbooks are ActiveX documents. Workbooks are compatible with a variety of foreign file formats ( all the Microsoft Office documents) that can be easily inserted into workbooks and in-place edited.
User notes and comments in workbooks
Workbooks offer powerful options to efficiently manage even extremely large amounts of output, and they may be the best output handling solution for both novices and advanced users. It might appear that one of their possible drawbacks is that user comments ( notes) and supplementary information cannot be as transparently inserted into the stream of the workbook output as they can in traditional, word processor style reports, such as StatisticaReports. However, note that:
- All Statistica documents can easily be annotated, both (a) directly, by typing text into graphs, tables, and reports, and (b) indirectly, by entering notes into the Comments box of the Document Properties dialog boxes, and
- Formatted documents with notes and comments (in the form of text files, Statistica Report documents, WordPad or word processor documents, etc.) can easily be inserted anywhere in the hierarchical organization of output in workbooks. Moreover, such summary notes or comment documents can be made nodes for groups of subordinate objects to which the note is related to further enhance their organization.
Saving workbooks as Web pages
Workbooks can be saved as *.html (Web) files by selecting Save As from the StatisticaFile menu, and in the Save As dialog box, choosing Web Page (*.htm; *.html) from the Save as type drop-down list. Saving as a Web page will create an *.html file in the specified directory that can be opened with standard internet browsers such as Microsoft Internet Explorer.
When saving the workbook as a Web page, Statistica also creates a subdirectory that contains all the images referenced by the Web page. The Web page output contains an .html-based tree control that enables you to navigate and display the various workbook images, similar to the actual workbook.
Stand-Alone Windows
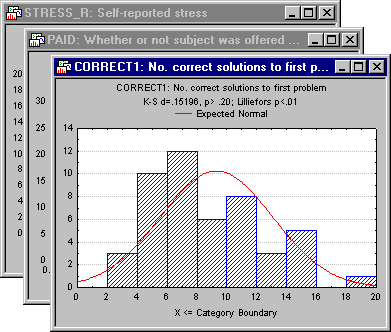
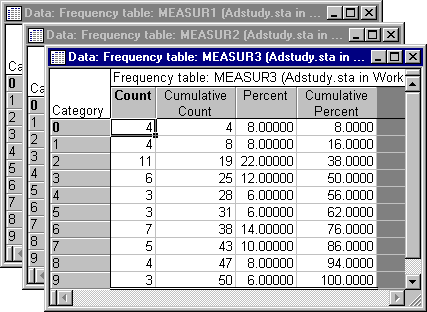
Statistica output documents can also be directed to a queue of stand-alone windows; the Queue Length can be controlled on the Output Manager tab of the Options dialog box.
The clear disadvantage of this output mode is its total lack of organization and its natural tendency to clutter the application workspace (note that some procedures can generate hundreds of tables or graphs with a click of the button).
One of the advantages of this way of handling output is that you can easily custom arrange these objects within the Statistica application workspace (suchas to create multiple, easy to identify reference documents to be compared to the new output). However, In order to achieve that effect, you do not need to configure the output ahead of time and generate a large number of (mostly unwanted) separate windows that can clutter the workspace. Instead, individual, specific output objects directed to and stored in the other two channels (workbooks and reports) can easily be dragged out from their respective tree views onto the application workspace as needed.
Reports
When performing an analysis, the ultimate goal is to create meaningful output in order to gain an understanding of the data.
The manner in which the output is produced is important as well. Statistica offers a variety of methods to produce reports that accommodate the diverse needs of users.
Statistica Reports. Statistica Reports offer a more traditional way of handling output where each object ( a Statistica Spreadsheet or Graph, or a Microsoft Excel spreadsheet) is displayed sequentially in a word processor style document.
Like the workbook, the Statistica. Report is also an ActiveX container where each of its objects (not only Statistica Spreadsheets and Graphs, but also any other ActiveX compatible documents, [ Microsoft Excel spreadsheets]) remains active, customizable, and in-place editable.
The obvious advantages of this way of handling output (more traditional than the workbook) are the ability to insert notes and comments "in between" the objects as well as its support for the more traditional way of quick scrolling through and reviewing the output to which some users may be accustomed (the editor supports variable speed scrolling and other features of the IntelliMouse). Also, only the report output includes and preserves the record of supplementary information, which contains a detailed log of the options specified for the analyses ( selected variables and their labels, long names, etc.) depending on the level of supplementary information specified on the Output Manager tab of the Options dialog box.
The obvious drawback, however, of these traditional reports is the inherent flat structure imposed by their word processor style format, although that is what some users or certain applications may favor.
Reports from workbooks
When you have a Statistica Workbook containing analyses output, you may decide you want to transfer it to a report. The advantages of this way of handling output are the ability to insert notes and comments in between the objects, as well as its support for the more traditional way of quick scrolling through and reviewing the output to which some users may be accustomed. Also, only the report output includes and preserves the record of the supplementary information, which contains a detailed log of the options specified for the analyses (selected variables and their labels, long names, etc.) depending on the level of supplementary information specified in the Output Manager tab of the Options dialog box.
In an open workbook, select all of the files, i.e., select the first file, press the SHIFT key on your keyboard, and select the last file. Then, click the Add to Report button on the toolbar. All the files in the workbook will be duplicated in a Statistica Report.
RTF (Rich Text Format) Reports
RTF is a Microsoft standard method of encoding formatted text and graphics for easy transfer between applications. When reports are saved in Rich Text Format (*.rtf), all file formatting is preserved so that it can be read and interpreted by other RTF-compatible applications ( Word).
The Statistica Report format (.str) adheres to RTF conventions; however, saving reports in the default Statistica Report format ensures that the reports will be opened in Statistica , giving you complete access to the report tree.
In order to open a Statistica report in an RTF-compatible application, open the report and select Save As from the File menu to display the Save As dialog box. From the Save as type drop-down list, select Rich Text Files (*.rtf), enter a name in the File name field, and click the Save button. You can then open the file in any RTF-compatible application.
Acrobat (PDF) Reports
PDF is the acronym for Portable Document Format; it is the industry-standard format for storing textual and graphical data. PDF offers a graphically rich appearance and structure that makes it ideal for presentation purposes. Additionally, PDF documents can be viewed in both image and textual mode, i.e., you can either select data as a formatted image or as regular text.
PDF is platform independent, and most operating systems offer free PDF viewing applications (Adobe Acrobat on Windows and Ghostscript on Linux). PDF has been approved as an acceptable document storage format for regulated environments according the FDA’s 21 CFR Part 11.
To save a Statistica Report as a PDF file:
-
- Sselect
Save As PDF from the
File menu.
The Output Options dialog box will be displayed, where you can choose whether to output spreadsheets as Objects (as they are sized in the Report window) or Full-sized Spreadsheets (on separate pages).
If you always want to output spreadsheets in the same manner:
- Sselect
Save As PDF from the
File menu.
-
- Click the Save button. Statistica Reports, Spreadsheets, and Graphs can all be saved in PDF format. These are not simplified PDF files (representing compressed bitmaps of the respective document page images) but full-featured PDF files that support such operations as selective copying of text information.
Microsoft Word
Statistica also allows routing output directly to Word via the Office Integration features.
When Word is open within Statistica , Word toolbars and menus are also available through standard Active X Document interfaces technology. In Statistica , you can perform any formatting and editing that Word supports in its application.
When sending spreadsheet analytical results to Word, Statistica will take advantage of Word’s table editing facility, and convert the spreadsheet to a table. For multi-page spreadsheets, you can control where to break the rows and columns. These spreadsheets will be broken by columns such as will be allowed without exceeding the page width. All rows for a given set of columns will be rendered before the next set of spreadsheet columns is rendered in the Word document. This solution enables the presentation of spreadsheets in Word that are natively editable in Word, displays the entire contents of the spreadsheet, and prints and paginates correctly.
As with standard Statistica Reports, Word documents can store and preserve the record of supplementary information (selected variables, long names, etc.).
To send output to a Word document:
-
- Use the options on the Output Manager tab of the Options dialog box.
Although Word documents do not provide the navigational tree of a Statistica Workbook or Report, the advantages in sending output to Word documents are many. By sending results to a Word document, you have all the word processing features of Word at your finger tips. For example, you can attach templates to create customized documents, add tables of content and indices, track changes, etc.
When inserting a large spreadsheet into a Word document, Statistica automatically detects how many variables can fit on each page and partitions the spreadsheet into several Word tables. If the spreadsheet uses case names, those names will be the first column in each table.
Additional benefits of sending results to a Word document include increased printing functionality (printing to files, manual duplex) and the ability to save results as Web pages.
Note
In some Microsoft Word installations, not all Word components are installed, such as those for importing and exporting various formats. When this occurs, it can result in an installation prompt to install these components from Microsoft Word.
If this prompt is displayed, follow the instructions, or if you don't have administrative rights on the machine, contact your system administrator to complete the Microsoft Word installation.
HTML Reports
You may want to post a Statistica Report or Workbook on the Internet for others to review.
With Statistica , you can save reports and workbooks in HTML format. HTML is an acronym for HyperText Markup Language. HTML uses tags to identify elements of the document, such as text or graphics.
After opening a Statistica Report or Workbook, and select Save As from the File menu to display the Save As dialog box. From the Save as type drop-down list, select HTML files (*.html; *.htm) to save the file with an *.htm extension.
Any graphs in the report or workbook are saved as *.png files in the same folder as the HTM file using the following naming convention: reportname_pict0001.png, reportname_pict0002.png, etc. You can save graphs as JPG files, instead. To do this, select Options from the Tools tab or menu to display the Options dialog box. Select either the Reports or Workbooks tab, according to which document you intend to send to an .htm document, select the JPEG format option button in the Export HTML images as group box, and click OK.
Knowledge Portal
Statistica Enterprise Server provides another way to distribute reports through the Knowledge Portal.
The Knowledge Portal enables you to publish Statistica documents (spreadsheets, graphs, reports, or workbooks) to the Internet. Users with limited Knowledge Portal permissions can then view those documents. You can control who can access these documents by setting permissions on the documents and directories using standard Statistica Enterprise Server repository tools.


