Example 3: Comparing Survival in Two or More Groups
This example uses the data file Heart.sta; see the Survival Analysis Examples - Overview and Data File topic for a description of this data file. Variable Hospital in the Heart.sta data file is a (fictitious) grouping variable that identifies the hospital where each patient received the heart transplant. There are three hospitals represented in this study: Hillview (coded 1), St_Andreas (coded 2), and Biner (coded 3). After comparing the survival functions at the three hospitals, some of the two-sample tests that are available in the Survival Analysis module are reviewed.
Specifying the Analysis
Open the
Heart.sta data file using the
File - Open Examples menu; it is in the Datasets folder.
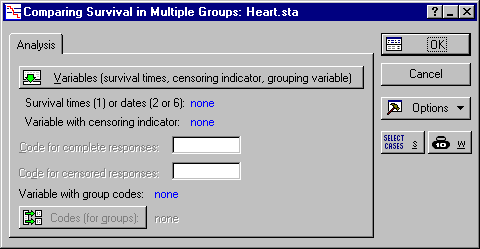
- Select Survival Analysis from the Statistics - Advanced Linear/Nonlinear Models menu to display the Survival and Failure Time Analysis Startup Panel. Double-click Comparing multiple samples to display the Comparing Survival in Multiple Groups dialog box.
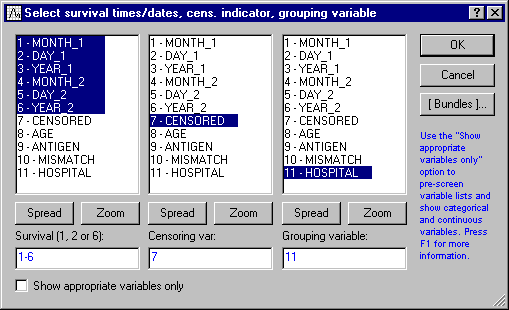
- Click the Variables button to display the standard variable selection dialog box. Here, select the first 6 variables as the Survival (1, 2 or 6). Statistica interprets the first and fourth variable in the list as months, the second and fifth as days, and the third and sixth as years. Next, you need to specify variable Censored as the Censoring var and variable Hospital as the Grouping variable.
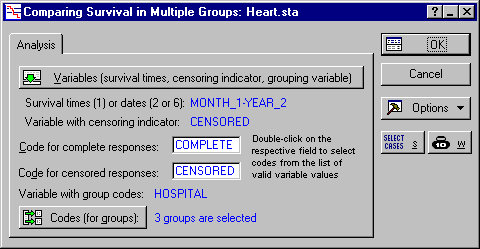
- Click OK to return to the Comparing Survival in Multiple Groups dialog box. Double-click in the Code for complete responses field to display the Variable 7 dialog box. Here, select Complete and click OK. In the same manner, double-click the Code for censored responses field and select Censored. To enter the codes for the grouping variable, click the Codes (for groups) button and then in the resulting dialog box, first click the All button (to select all of the codes) and then click OK (to accept these codes and exit the dialog box). The Comparing Survival in Multiple Groups dialog box now looks like this.
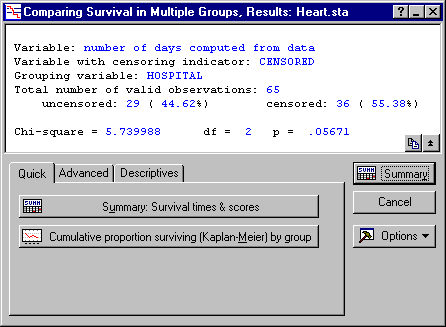
- You are now ready to proceed; click OK and the Comparing Survival in Multiple Groups, Results dialog box is displayed.
- The test for multiple samples is explained in the Introductory Overview. The overall Chi-square test is almost significant in this example (p<.06). Therefore, you would tentatively conclude that there are some differences between hospitals.
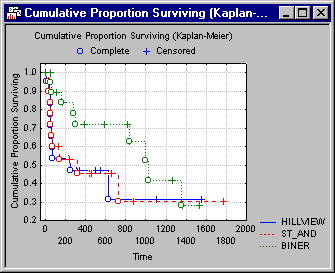
- To see those differences, you can plot the survival functions for the different groups, that is, click the Cumulative proportion surviving (Kaplan-Meier) by group button.
- Clearly, the survival function in the Biner hospital shows a slower initial drop-off as compared to the other hospitals. Therefore, you would conclude that, somehow, heart transplant patients in the Biner hospital have a greater chance of survival, particularly during the critical first 100 days after the transplant.
- Return to the Comparing Survival in Multiple Groups, Results dialog box and click the Advanced tab. To review the life tables for the three hospitals, click the Percent surviving by group button. A separate spreadsheet for each hospital is displayed, which confirms the above conclusion.
Comparing Survival in Two Groups
The Survival Analysis module includes various methods for comparing two samples.
- Click the Cancel button on both the Comparing Survival in Multiple Groups, Results dialog box and the Comparing Survival in Multiple Groups dialog box to return to the Startup Panel.
- Double-click the Comparing two samples option on the Startup Panel to display the Comparing Survival in Two Groups dialog box. Click the Variables button and specify all of the variables as before. Also, specify the Code for complete responses and the Code for censored responses as before.
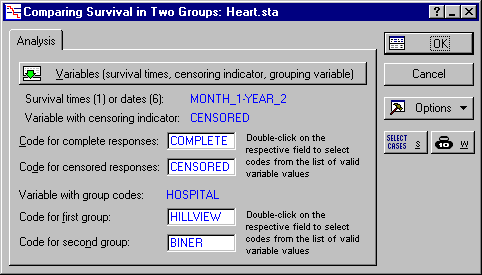
- To compare groups, double-click the Code for first group field to display the Variable 11 dialog box. Here, select the first group to compare (in this case, select Hillview) and click OK. In the same manner, double-click the Code for second group field and select Biner. The Comparing Survival in Two Groups dialog box now looks like this.
- Click OK to go to the Two-Sample Tests Results dialog box.
- The different two-sample tests are described and compared in the Introductory Overview. In this example, some of the tests yield significance levels at around p=.05, while others are not significant. Therefore, you might only tentatively conclude that, indeed, the survival of heart transplant patients from these two hospitals differ significantly, with the Biner hospital producing the better results (survival).
Copyright © 2021. Cloud Software Group, Inc. All Rights Reserved.

