Bag Plots - Introductory Overview
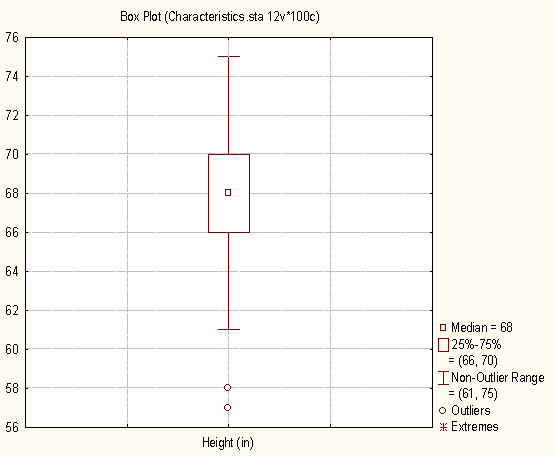
Bag plots (Rousseeuw, Ruts, & Tukey, 1999) are the bivariate extension of the univariate box plot. The box plot (this term was first used by Tukey, 1970) is a tool for exploratory data analysis. With a box plot, the important characteristics of a distribution (location, dispersion, skewness, and tails) can be quickly visualized. An example of a box plot can be seen below.
Extending the box plot into two dimensions, the bag plot visualizes the following characteristics of the bivariate distribution:
Location (Tukey median)
Spread (Size of the bag)
Correlation (Orientation of the bag)
Skewness (Shape of the bag and the whiskers)
Tails (long whiskers and outliers)
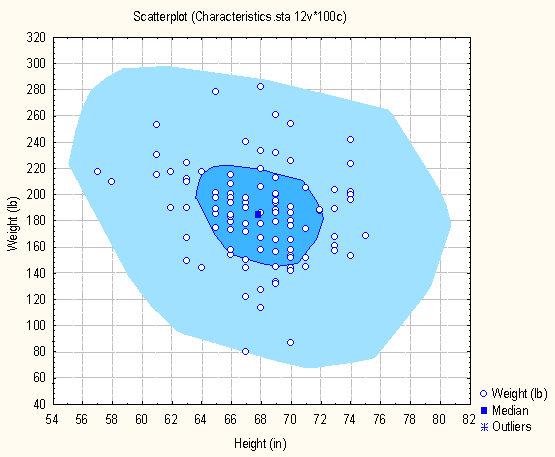
An example of a bag plot can be seen below.
Depth as a bivariate generalization of rank
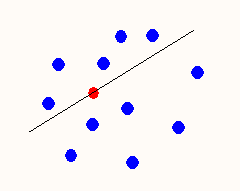
The central concept with the bag plot is the depth (halfspace location depth) of a point relative to a bivariate data set. This allows one to extend the notion of rank beyond one dimension. Let’s look at the computation of the Tukey median (bivariate median) in order to understand this. First, consider the case of finding the median for a univariate data set. Consider the small set of a data consisting of 5 numbers {1, 2, 3, 4, 5}. In this example, the median is simply the middle value. However, we can think of computing the median in a different way. For a given set of data, the depth of an arbitrary point is equal to the minimum of ( # {zi <= x}, #{zi >= x}), that is we find the number of data points to the left and to the right of the data point and take the minimum value. For the dataset a = {1, 2, 3, 4, 5}, let’s compute the depth for data point 3. The #{zi <= x} is equal to 3 and the #{zi >= x} is also equal to 3. This also happens to the point with the deepest depth, that is, it has the maximum of the minimum of ( # {zi <= x}, #{zi >= x}). The point with the deepest depth is known as the Tukey median. In two dimensions, depth of a point X is the smallest number of data points that are contained in a closed half plane with boundary line through the point X. You can calculate the depth by rotating a line through the point X 180 degrees and counting the number of points that fall on both sides of the line.
Depth region, Bag, and Fence
Once you have depth, then you can calculate the Tukey median which is the point with maximum depth. The bag and fence can now be calculated as depth regions. Specifically, the bag is a depth region (which is a convex polygon) that contains 50% (by default) of the points with the largest depth. The fence is augmented by a factor of 1.5 (by default). Points that are outside of the outer fence will be marked as outliers.